• Skip to primary navigation
  • Skip to main content
  • Skip to primary sidebar

Yellow Bricks

by Duncan Epping

  • Home
  • ESXTOP
  • Stickers/Shirts
  • Privacy Policy
  • About
  • Show Search
Hide Search

monitoring

Opvizor Performance Analyzer for vSAN

Duncan Epping · Jul 10, 2018 ·

At a VMUG a couple of months ago I bumped into my old friend Dennis Zimmer. Dennis told me that he was working on something cool for vSAN but couldn’t reveal what it was just yet. Last week I had a call with Dennis about what that thing was. Dennis is the CEO for Opvizor, and some of you may recall the different tooling that Opvizor has produced over the years, of which the Health Analyzer was probably the most famous one back then. I’ve used it in the past on various occasions and I had various customers using it. During the briefing, Dennis explained to me that Opvizor started focussing on performance monitoring and analytics a while ago as the health analyzer market was overly crowded and had the issue that is was a one-off business (checks once in a while instead of daily use). On top of that, many products now come with some form of health analysis included. (See vSAN for instance.) I have to agree with Dennis, so this pivot towards Performance Monitoring makes much sense to me.

Dennis explained to me how they are seeing more and more customer demand for vSAN performance monitoring especially combined with VMware ESXi, VM and App data. Although vCenter has various metrics, and there’s VROps, he told me that Opvizor has many customers who need more than vCenter or vROPS standard has to offer today and don’t own VROps advanced. This is where Opvizor Performance Analyzer comes in to play and that is why today Opvizor announced they are including vSAN specific dashboards. Now, this isn’t just for vSAN of course. Opvizor Performance Analyzer includes not just vSAN but also vSphere and various other parts of the stack. When talking with Dennis one thing became clear, Opvizor is taking a different approach than most other solutions. Where most focus on simplifying, hiding, and aggregating, the focus for Opvizor is on providing as much relevant detail as possible to fulfill the needs of beginner and professional.

So how does it work? Opvizor provides a virtual appliance. You simply deploy it in your environment and connect it to vCenter and you are ready to go. The appliance collects data every 5 minutes (but 20 seconds intervals of these 5 minutes) and has a retention of up to 5 years. As I said, the focus is on infrastructure statistics and performance analytics and as such Opvizor delivers all the data you ever need.

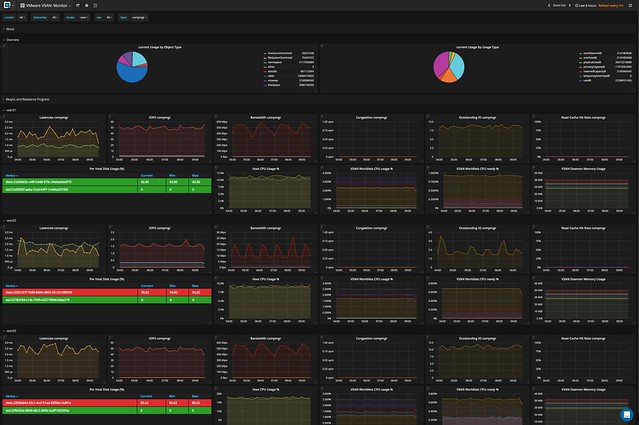
It doesn’t just provide you with all the info you will ever need. It will also allow you to overlay different metrics, which makes performance troubleshooting a lot easier, and will allow you to correlate and pinpoint particular problems. Opvizor comes with dashboards for various aspects, here are the ones included in the upcoming release for vSAN:

  • Capacity and Balance
  • Storage Diskgroup Stats
  • VM View
  • Physical disk latency breakdown
  • Cache Diskgroup stats
  • vSAN Monitor

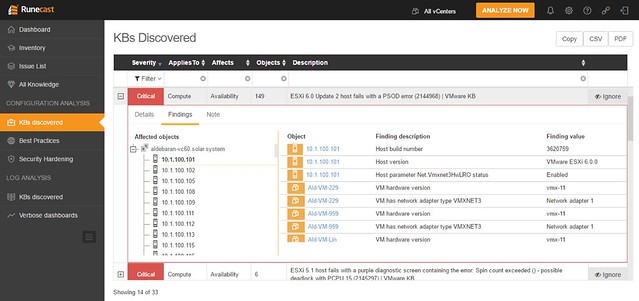
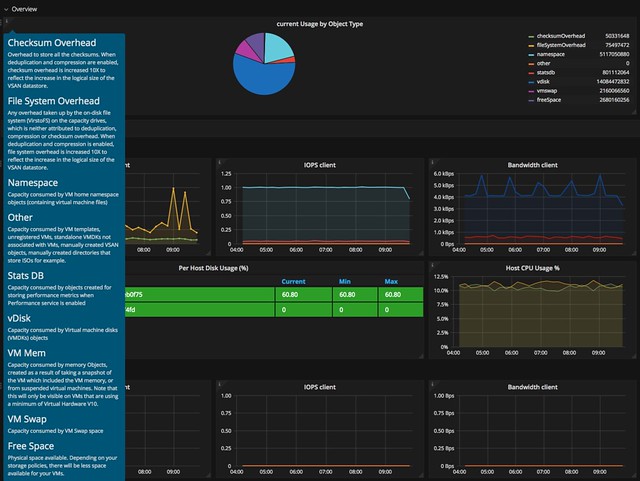
Now I said this is the expert´s troubleshooting tool, but Opvizor Performance Analyzer also provided in-depth information about what each metric is / means and provides starter dashboards for beginners. You can simply click on the “i” in the top left corner of the widget and you get all the info about that particular widget.

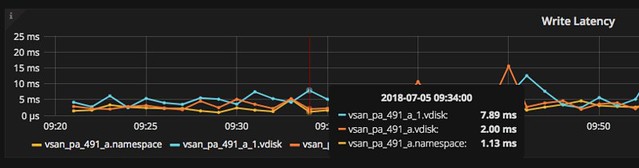
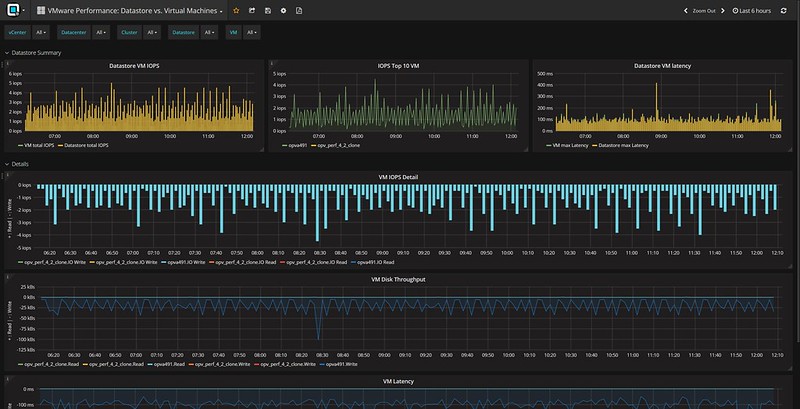
When you do know what you are looking for you can click, hover, and zoom when needed. Hover over the specific section in the graph and the point in time values of the metrics will pop up. In the case below I was drilling down on a VM in the vSAN cluster and looking at write latency in specific. As you can see we have 3 objects and in particular 2 disks and a “vm name space”.

And this is just a random example, there are many metrics to look at and many different widgets and overviews. Just to give you an idea, here are some of the metrics you can find in the UI:

  • Latency (for all different components of the stack)
  • IOPs (for all different components of the stack)
  • Bandwidth (for all different components of the stack)
  • Congestion (for all different components of the stack)
  • Outstanding I/O (for all different components of the stack)
  • Read Cache Hit rate (for all different components of the stack)\
  • ESXi vSAN host disk usage
  • ESXi vSAN host cpu usage
  • Number of Components
  • Disk Usage
  • Cache Usage

And there;s much more, too many to list in this blog. And again, not just vSAN, but there are many dashboards to chose from. If you don’t have a performance monitoring solution yet and you are evaluating solutions like SolarWinds, Turbunomics and others make sure to add Opvizor to that list. One thing I have to say, I spotted a couple of things that I liked to see changed, and I think within 24hrs the Opvizor guys managed to incorporate the feedback. That was a crazy fast turnaround, good to see how receptive they are.

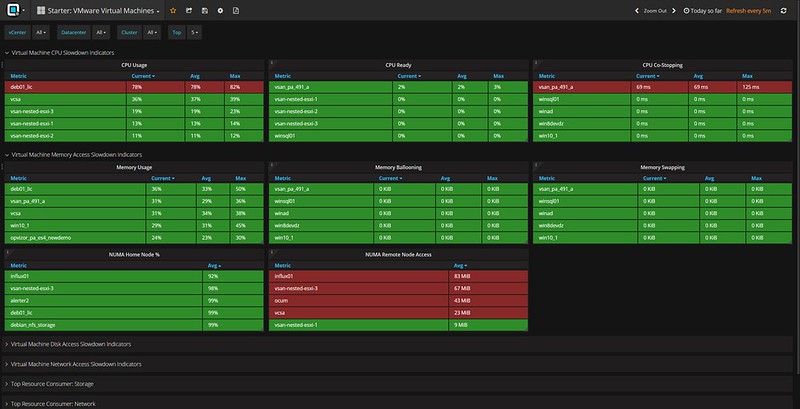
Oh, one more thing I found in the interface, it is these dashboards that deal with things like NUMA. But also things like the Top 10 VMs in terms of IOPS. Both very useful, especially when doing deep performance troubleshooting and optimizing.

I hope that gives you a sense of what they can do. There’s a fully functional 30-day trial, check it out if you want to find out more about Performance Analyzer or simply just want to play around with it. Opvizor announced this brand new version on their own blog here, make sure to give that a read as well!

VMkernel Observations (VOBs)

Duncan Epping · Jul 7, 2017 ·

I never really looked at VOBs but as this came up last week during a customer meeting I decided to look in to it a bit. I hadn’t realized there was such a large number of them in the first place. My conversation was in the context of vSAN, but there are many different VOBs. For those who don’t know VOBs are system events. These events are logged and you can create different alarms for when they are being logged.

You can check the full list of VOBs on ESXi, SSH in to it and then look at this file:

  • /usr/lib/vmware/hostd/extensions/hostdiag/locale/en/event.vmsg

When they are triggered you will see them here:

  •  /var/log/vobd.log

And as stated when you want to do something with them you can create a customer alarm. Select “specific event occuring on this object” and click next:

Now you add an event, simply click the “+” and remove the current value and simply copy/paste the VOB string in, the string will look something like this: “esx.problem.vob.vsan.pdl.offline”. Hit enter when you added it and then click “Next” and “Finish”.

I find the following useful myself:

  • esx.problem.vsan.net.redundancy.reduced
  • esx.problem.vob.vsan.lsom.componentthreshold
  • esx.problem.vob.vsan.lsom.diskerror
  • esx.problem.vob.vsan.pdl.offline
  • esx.problem.vsan.lsom.congestionthreshold
  • esx.problem.vob.vsan.dom.nospaceduringresync

There are many more, and I just listed those I found useful for vSAN, for more detail check the following links:

  • https://docs.vmware.com/en/VMware-vSphere/6.0/com.vmware.vsphere.virtualsan.doc/GUID-FB21AEB8-204D-4B40-B154-42F58D332966.html
  • http://www.virtuallyghetto.com/2015/03/new-vobs-for-creating-vcenter-server-alarms-in-vsphere-6-0.html
  • http://www.virtuallyghetto.com/2014/04/handy-vsan-vobs-for-creating-vcenter-alarms.html
  • http://www.virtuallyghetto.com/2014/04/other-handy-vsphere-vobs-for-creating-vcenter-alarms.html


Startup intro: Runecast

Duncan Epping · Mar 7, 2017 ·

I met with Runecast a couple of years ago at VMworld. Actually, I am not sure they already had a name back then, I should probably say I met with the guys who ended up founding Runecast at VMworld. One of them, Stan, is a VCDX and back then he pitched this idea to me around an appliance that would analyze your environment based on a set of KBs. His idea was primarily based on his experience managing and building datacenters. (Not just Stan’s experience, but most of the team are actually former IBM employees) Interesting concept, kind of sounded similar to CloudPhysics to me, although the focus was more on correlation of KB then capacity management etc.

Fast forward to 2017 and I just finished a call with the Runecast team. I had a short conversation at VMworld 2016 and was under the impression that they sold the company or quit. None of this is true. Runecast managed to get a 1.6m euro funding (Czech Republic) and is going full steam ahead. With around 10 people, most being in Czech Republic they are ready to release the next version of Runecast Analyzer, which will be 1.5. So what does this provide?

Well just imagine you manage a bunch of hosts and vCenter (not unlikely when you visit my blog), maybe some shared storage along with it. There are many KB articles, frequent updates of these and many newly published KBs every week. Then there’s also a whole bunch of best practices and of course the vSphere Hardening Guide. As an administrator do you have time to read everything that is published every day? And then when you have read it, do you have time to check your environment if the issue or best practice described applies to your infrastructure? Of course you don’t, and this is where Runecast Analyzer comes in to play.

You download the appliance and provision it in to your environment, next you simply hook vCenter Server in to it and off you go. (As of 1.5 it also supports connecting several vCenter Server instances by the way.) Click analyze now and check the issues called out in the HTML-5 dashboard. As the screenshot below shows, this particular environment has issues identified in the log file that are described in a KB article. There are various other KB articles that may apply, just as an example: a combination of a certain virtual NIC with a specific OS may not be recommended. Also, various potential security issues and best practices are raised if they exist/apply.

When you would click one of these areas you can drill down in to what the issue is and potentially figure out how to mitigate it. In the screenshot below you see the list of KBs that apply to this particular environment, you can open the particular entry (second screenshot below) and then find out to what it applies (objects: VMs, hosts, vCenter etc). If you feel it doesn’t apply to you, or you accept the risk, you can of course “ignore” the issue. When you click ignore a filter will be created which rules out this issue from being called out through the dashboard. The filtering mechanism is pretty smart, and you can easily create your own filters on any level of the virtual infra hierarchy. Yes, it is also possible to delete the filter(s) again when you feel it does apply to your environment.

Besides checking the environment, as mentioned, Runecast can also analyze the logs for you. And I was happy to see that this got added, as it makes it unique compared to other solutions out there. Depending on what you are looking for you have these quick filtering options, and of course there are search strings and you can select a time period in which you would like to search of this particular string

As I said, all of this comes as a virtual appliance, which does not require direct connection to the internet. However, in order to keep the solution relevant you will need to update regularly, they mentioned they release a new data set once every two weeks roughly. It can be updated over the internet (through a proxy if needed), or you can download the ISO and update Runecast Analyzer through that, which could be very useful in secure locations. The appliance works against vSphere 5.x and 6.x (yes including 6.5) and there is a 30 day free trial. (Annual subscription, per socket pricing.) If you like to give it a try, click the banner on the right side, or go to their website: https://www.runecast.biz/. Pretty neat solution, and looking forward seeing what these guys can achieve with the funding they just received.

CloudPhysics card builder, how awesome is that?

Duncan Epping · Jul 2, 2013 ·

A while ago Irfan Ahmad (CloudPhysics CTO), Frank Denneman and I were discussing various ideas around the CloudPhysics platform… One of the ideas that Ifran and team pitched was this notion of a card builder. Both Frank and I are advisors to CloudPhysics and immidiately jumped up and said “YES PLEASE, when can we have it?” Over the last couple of weeks you have probably seen various blog posts pop up about the card builder that CloudPhysics created and I can honestly say that it has exceeded my expectations. (Suggested reads: Willam’s blog post, Anthony Spiteri’s post) So what is so special about this card designer? I think this paragraph from William’s blog post describes it best:

The vSphere platform provides a very powerful and rich set of APIs (Application Programming Interface) that can be consumed by both vSphere administrators as well as developers. However, there is a high learning curve when using the API and it takes quite a bit of time to learn and of course your manager is expecting the report to be done in the next 5 minutes. Even with abstraction tools such as PowerCLI, quickly building a robust, scalable and performant script is not always a trivial task, not to mention the maintenance and updates to the script because your manager wants to continually add more things to the report.

Not everyone is an API guru like William or a scripting god like Alan Renouf or Luc Dekens. Sure, these guys will knock out an awesome looking report in a matter of minutes, maybe 10 – 15 minutes depending on what kind of metrics they need and how complex the report will be. For normal people, like myself, who aren’t scripting gods this typically takes a lot longer. Personally I am happy if I can produce something within an hour, but when it gets more complex you are probably talking about way more than that, potentially a full day. The CloudPhysics card builder was designed to lower the barrier to create meaningful reports!

How simple is it? I would say, that if I can figure it out in seconds it is dead simple:

  1. Click “Card Builder”
    CloudPhysics Card Builder
  2. Click “Create card”
    CloudPhysics Card Builder
  3. Select the “Property”
    CloudPhysics Card Builder
  4. I selected “Datastore:Name” and “Datastore:Attached Hosts” and below the results
    CloudPhysics Card Builder

That is it, really easy right? In just a couple of clicks I can see which hosts are connected to which datastores. Yes of course this was a simple example, but the nice thing is that you can make it as complex as you want or need. Currently this is in a limited Beta, but soon (I mean really soon!!) this will be exposed to the rest of the world. If you want to know more, just check the webinar recording by Irfan link can be found on the CPhy website!

Only thing I wonder is… why on earth did no one come up with this concept before for the virtualization space? Creating reports and should always be dead simple if you ask me, and now with CloudPhysics Card Builder it finally is.

The State of vSphere Clustering by @virtualirfan

Duncan Epping · Oct 23, 2012 ·

The state of vSphere clustering
By Irfan Ahmad

Some of my colleagues at CloudPhysics and I spent years at VMware and were lucky to have participated in one of the most rapid transformations in enterprise technology history. A big part of that is VMware’s suite of clustering features. I worked alongside Carl Waldspurger in the resource management team at VMware that brought to the world the ESX VMkernel CPU and memory schedulers, DRS, DPM, Storage I/O Control and Storage DRS among other features. As a result, I am especially interested in analyzing and improving how IT organizations use clustering.

Over a series of blog posts, I’ll try to provide a snapshot of how IT teams are operationalizing vSphere.  One of my co-founders, Xiaojun Liu and I performed some initial analysis on the broad community dataset that is continually expanding as more virtualization engineers securely connect us to their systems.

First, we segmented our analysis based on customer size. The idea was to isolate the effect of various deployment sizes including test labs, SMBs, commercial and large enterprise, etc. Our segmentation was in terms of total VMs in customer deployments and divided up as: 1-50 VMs, 51-200, 201-500, 501-upwards. Please let us know if you believe an alternative segmentation would warrant better analysis.

Initially we compared various ESX versions deployed in the field. We found ESXi 5.0 already captured the majority of installations in large deployments. However, 4.0 and 3.5 versions continue to be deployed in the field in small numbers. Version 4.1, on the other hand, continues to be more broadly deployed. If you are still using 4.1, 4.0, and 3.5, we recommend upgrading to 5.0 which provides greatly improved HA clustering, amongst many other benefits. This data shows the 5.0 version has been broadly adopted by our peers and is user-verified production ready.

Next, we looked at cluster sizes. A key question for VMware product managers was often, “How many hosts are there in a typical cluster?” This was a topic of considerable debate, and it is critically important to know when prioritizing features. For example, how much emphasis should go into scalability work for DRS.

For the first time, CloudPhysics is able to leverage real customer data to provide answers. The highest frequency cluster size is two hosts per cluster for customers with greater than 500 VMs. Refer to the histogram. This result is surprisingly low and we do not yet know all the contributing reasons, though we can speculate on some of the causes. These may be a combination of small trainiång clusters, dedicated clusters for some critical applications, Oracle clustering license restrictions, or perhaps a forgotten pair of older servers. Please tell us why you may have been keeping your clusters small.

Despite the high frequency of two-host clusters, we see opportunities for virtualization architects to increase their resource pooling. By pooling together hosts into larger clusters, DRS can do a much better job at placement and providing resource management. That means real dollars in savings. It also allows for more efficient HA policy management since the absorption of spare capacity needed for infrequent host failures is now spread out over a larger set of hosts. Additionally, having fewer clusters makes for fewer management objects to configure, keep in sync with changing policies, etc. This reduces management complexity and makes for a safer and more optimized environment.

Several caveats arise with regard to the above findings. First is potential sample bias. For instance, it might be the case that companies using CloudPhysics are more likely to be early adopters and that early adopters might be more inclined to upgrade to ESX 5.0 faster. Another possible issue is imbalanced dataset composition. It might be that admins are setting up small training or beta labs, official test & development, and production environments mixed in the same environment thus skewing the findings.

CloudPhysics is the first to provide a method of impartially determining answers based on real customer data, in order to dampen the controversy.

Xiaojun and I will continue to report back on these topics as the data evolves. In the meantime, the CloudPhysics site is growing with new cards being added weekly. Each card solves daily problems that virtualization engineers have described to us in our Community Cards section. I hope you will take the time to send us your feedback on the CloudPhysics site.

  • Go to page 1
  • Go to page 2
  • Go to page 3
  • Go to Next Page »

Primary Sidebar

About the author

Duncan Epping is a Chief Technologist in the Office of CTO of the Cloud Platform BU at VMware. He is a VCDX (# 007), the author of the "vSAN Deep Dive", the “vSphere Clustering Technical Deep Dive” series, and the host of the "Unexplored Territory" podcast.

Upcoming Events

May 24th – VMUG Poland
June 1st – VMUG Belgium

Recommended Reads

Sponsors

Want to support Yellow-Bricks? Buy an advert!

Advertisements

Copyright Yellow-Bricks.com © 2023 · Log in