• Skip to primary navigation
  • Skip to main content
  • Skip to primary sidebar

Yellow Bricks

by Duncan Epping

  • Home
  • Unexplored Territory Podcast
  • HA Deepdive
  • ESXTOP
  • Stickers/Shirts
  • Privacy Policy
  • About
  • Show Search
Hide Search

Trigger APD on iSCSI LUN on vSphere

Duncan Epping · Jun 21, 2018 ·

I was testing various failure scenarios in my lab today for the vSphere Clustering Deepdive session I have scheduled for VMworld. I needed some screenshots and log files of when a datastore hit an APD scenario, for those who don’t know APD stands for all paths down. In other words: the storage is inaccessible and ESXi doesn’t know what has happened and why. vSphere HA has the ability to respond to that kind of failure. I wanted to test this, but my setup was fairly simple and virtual. So I couldn’t unplug any cables. I also couldn’t make configuration changes to the iSCSI array as that would rather trigger a PDL (permanent device loss), so how do you test and APD scenario?

After trying various things like killing the iSCSI daemon (it gets restarted automatically with no impact on the workload) I bumped in to this command which triggered the APD:

  • SSH in to the host you want to trigger the APD on, run the following command
    esxcli iscsi session remove  -A vmhba65
  • Make sure of course to replace “vmhba65” with the name of your iSCSI adapter

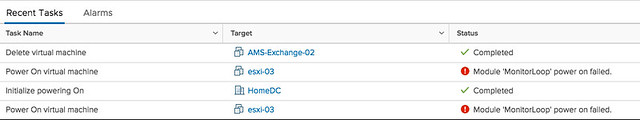
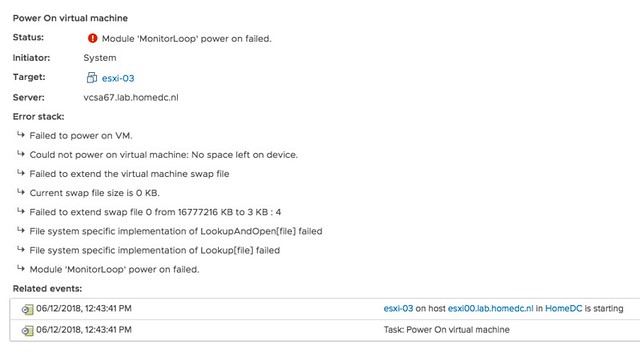
This triggered APD, as witness in the fdm.log and vmkernel.log, and ultimately resulted in vSphere HA killing the impacted VM and restarting it on a healthy host. Anyway, just wanted to share this as I am sure there are others who would like to test APD responses in their labs or before their environment goes in to production.

There may be other easy ways as well, if you know any, please share in the comments section.

Module MonitorLoop power on failed error when powering on VM on vSphere

Duncan Epping · Jun 12, 2018 ·

I was playing in the lab for our upcoming vSphere Clustering Deepdive book and I ran in to this error when powering on a VM. I had never seen it before myself, so I was kind of surprised when I figured out what it was referring to. The error message is the following:

Module MonitorLoop power on failed when powering on VM

Think about that for a second, if you have never seen it I bet you don’t know what it is about? Not strange as the message doesn’t give a clue.

f you go to the event however there’s a big clue right there, and that is that the swap file can’t be extended from 0KB to whatever it needs to be. In other words, you are probably running out of disk space on the device the VM is stored on. In this case I removed some obsolete VMs and then powered on the VM that had the issue without any problems. So if you see this “Module MonitorLoop power on failed when powering on VM” error, check your free capacity on the datastore the VM sits on!

More details:

Strange error message, for a simple problem. Yes, I will file a request to get this changed.


OSX audio stopped working

Duncan Epping · Jun 8, 2018 ·

I have this issue regularly where the OSX audio stopped working on my Macbook. I am using High Sierra right now but had the same problem with Sierra. Not sure what is causing the problem, and not sure how to prevent it from happening. I have figured out though how to solve it, and as occasionally I find myself searching for the solution I figured I would quickly document it on my own blog. If your audio has stopped working you can simply stop the service responsible for it.

For me the following works solving the problem:

sudo killall coreaudiod

For me audio comes back again automatically almost instantly, some actually have reported they need to start the service again

sudo launchctl start com.apple.audio.coreaudiod

I hope this helps others as well as running into the same problem. If you have and you solved the problem in a different way please leave a comment.

Customer Experience Improvement Program: where, when and what?

Duncan Epping · May 28, 2018 ·

I got a question on my post about the Customer Experience Improvement Program (ceip) demo, the questions boiled down to the following:

  • What is being send to VMware
  • Where is the data stored by VMware
  • When is the data send to VMware (how often)

The “what” question was easy to answer, as this was documented by John Nicholson on Storagehub.vmware.com for vSAN specifically. Realizing that it isn’t easy to find anywhere what ceip data is stored I figured I would add a link here and also repeat the summary of that article, assuming by now everyone uses a VCSA (if not go to the link):

  1. SSH into VCSA
  2. Run command: cd /var/log/vmware/vsan-health/
  3. Data collected by online health checks is written and gzipped to files " <uuid>cloud_health_check_data.json.gz" and " <uuid>vsan_perf_data.json.gz
  4. You can extract the json content by calling " gunzip -k <gzipped-filename> " or view the contents by calling " zcat <gzipped-filename> "

So that is how you view what is being stored, John also posted an example of the dataset on github for those who just want to have a quick peek. Note that you need an “obfuscation map” (aka key) to make sense out of the data in terms of host-names / VM names / ip-addresses etc. Without that you can stare at the dataset all you want, but you won’t be able to relate it back to a customer. I would also add that we are not storing any VM/Workload data, it is configuration data / feature usage / performance data. Hopefully that will answer the “what” question for you.

Where is the data stored? The data is send to “https://vcsa.vmware.com” and it ends up in VMware’s analytics cloud, which is hosted in secure data centers in the US. The frequency is a bit difficult to answer, as this fully depends on which products are in use, but to my knowledge with vSAN/vSphere it is on an hourly basis. I have asked the VMware team who owns this to create a single page/document with all of the required details needed in it so that security teams can simply be pointed to it.

Hopefully I will have a follow up soon.

How to simplify vSAN Support!

Duncan Epping · May 25, 2018 ·

Last week I presented at the Tech Support Summit in Cork with Cormac. Our session was about the evolution of vSAN, where are we today but more importantly which directly will we be going. One thing that struck me when I discussed vSAN Support Insight, the solution we announced not to long ago, is that not too many people seemed to understand the benefit. When you have vSAN and you enable CEIP (Customer Experience Improvement Program) then you have a phone home solution for your vSphere and vSAN environment automatically. What this brings is fairly simple to explain: less frustration! Why? Well the support team will have, when you provide them your vCenter UUID, instant access to all of the metadata of your environment. What does that mean? Well the configuration for instance, the performance data, logs, health check details etc. This will allow them to instantly get a good understanding of what your environment looks like, without the need for you as a customer to upload your logs etc.

At the event I demoed the Support Insight interface, which is what the Support Team has available, and a lot of customers afterwards said: now I see the benefit of enabling this, I will do this for sure when I get back to the office. So I figured I would take the demo, do a voice over and release it to the public. We need more people to join the customer experience improvement program, so watch the video to see what this gives the support team. Note by the way that everything is anonymized, without you providing a UUID it is not possible to correlate the data to a customer. Even when you provide a UUID the support team can only see the host, vm, policy and portgroup (etc) names when you provide them with what is called an obfuscation map (key). Anyway, watch the demo and join now!

  • « Go to Previous Page
  • Page 1
  • Interim pages omitted …
  • Page 75
  • Page 76
  • Page 77
  • Page 78
  • Page 79
  • Interim pages omitted …
  • Page 497
  • Go to Next Page »

Primary Sidebar

About the Author

Duncan Epping is a Chief Technologist and Distinguished Engineering Architect at Broadcom. Besides writing on Yellow-Bricks, Duncan is the co-author of the vSAN Deep Dive and the vSphere Clustering Deep Dive book series. Duncan is also the host of the Unexplored Territory Podcast.

Follow Us

  • X
  • Spotify
  • RSS Feed
  • LinkedIn

Recommended Book(s)

Also visit!

For the Dutch-speaking audience, make sure to visit RunNerd.nl to follow my running adventure, read shoe/gear/race reviews, and more!

Do you like Hardcore-Punk music? Follow my Spotify Playlist!

Do you like 80s music? I got you covered!

Copyright Yellow-Bricks.com © 2026 · Log in