• Skip to primary navigation
  • Skip to main content
  • Skip to primary sidebar

Yellow Bricks

by Duncan Epping

  • Home
  • Unexplored Territory Podcast
  • HA Deepdive
  • ESXTOP
  • Stickers/Shirts
  • Privacy Policy
  • About
  • Show Search
Hide Search

Now Available: vSphere 6.7 Clustering Deep Dive book!

Duncan Epping · Jul 30, 2018 ·

Over the past couple of months Frank, Niels and I have worked ferociously to update the vSphere Clustering Deep Dive. Some of the material was already brought up to date to vSphere 6.0 U2, but the majority was never updated after vSphere 5.1. As you can imagine, this was a tremendous undertaking. Not only did we need to validate every sentence, all diagrams needed to be updated, and with the introduction of the HTML-5 Client also all screenshots had to be retaken. 

Now, just a couple of weeks before VMworld, we are finally at the point where we can press “publish”.

What can you expect? Well, we have said this with previous books, this is not a beginners guide! This is a deep dive, and we aimed to take you in to the trenches of vSphere Clustering technologies. We cover a multitude of different features, and for those who haven’t read the previous books expect the following features to be covered:

  • vSphere HA
  • vSphere DRS
  • vSphere Storage DRS
  • vSphere Storage I/O Control
  • vSphere Network I/O Control

We also have a chapter on stretched clusters, in this chapter we describe how to design and implement a vSphere Metro Storage Cluster, leveraging all of the knowledge gained in the previous chapters.

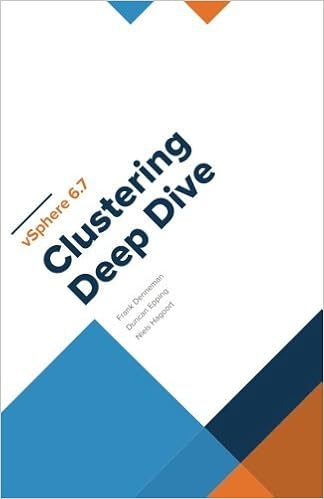
For your convenience, I copied/pasted some of the Amazon info below.

—

  • Paperback: 566 pages
  • Publisher: CreateSpace Independent Publishing Platform; 1 edition (July 29, 2018)
  • Language: English
  • ISBN-10: 1722625325
  • ISBN-13: 978-1722625320
  • Product Dimensions: 5.5 x 1.3 x 8.5 inches
  • Shipping Weight: 1.8 pounds

—

I hope all of you will enjoy the book as much as we enjoyed writing it. And before I forget, I want to thank my co-authors for the late night discussions, the hard work, insights and fun/laughter at times.

Get it while it is hot! (Look on the right side column for the links to the book!)

Insufficient configured resources to satisfy the desired vSphere HA failover level on the cluster

Duncan Epping · Jul 12, 2018 ·

I was talking to the HA team this week, specifically about the upcoming HA book. One thing they mentioned is that people still seem to struggle with the concept of admission control. This is the reason I wrote a whole chapter on it years ago, yet there still seems to be a lot of confusion. One thing that is not clear to people is the percentage calculations. We have some customers with VMs with extremely large reservations, in that case instead of using the “slot policy” they typically switch to “percentage based policy”. Simply as the percentage based policy is a lot more flexible.

However, recently we have had some customers that hit the following error message:

Insufficient configured resources to satisfy the desired vSphere HA failover level on the cluster

This error message, in the case of these particular situations (yes there was a bug as well, read this article on that), set the percentage lower than what would equal a full host. In other words, in a 4 host environment, a single host would equal 25%. In some cases, customers would set the percentage to a value lower than 25%. I am personally not sure why anyone would do this as it contradicts the whole essence of admission control. Nevertheless, it happens.

This message indicates that you may not have sufficient resources, in the case of a host failure, to restart all the VMs. This of course is the result of the percentage being set lower than the value that would equal a single host. Note though, this does not stop you from powering on new VMs. You will only be stopped from powering on new VMs when you exceed the available unreserved resources.

So if you are seeing this error message, please verify the configured percentage if you set it manually. Ensure that at a minimum it equals the largest host in the cluster.

** back to finalizing the book **


vSphere 6.5 and limits, do they still apply to SvMotion?

Duncan Epping · Jul 11, 2018 ·

I had a question this week and I thought I wrote about this before but apparently, I did not. Hopefully by now most of you the I/O scheduler has changed over the past couple of years. Within ESXi, we moved to a new scheduler, which often is referred to as mClock. This new scheduler, and a new version of SIOC (storage i/o control) also resulted in some behavioral changes. Some which may be obvious, others which are not. I want to explicitly point out two things which I have discussed in the past which changed with vSphere 6.5 (and 6.7 as such) and both are around the use of limits.

First of all: Limits and SvMotion. In the past when a limit was applied to a VM, this would also artificially limit SvMotion. As of vSphere 6.5 (may apply to 6.0 as well but I have not verified this) this is no longer the case. Starting vSphere 6.0 the I/O scheduler creates a queue for every file on the file system (VMFS), this to avoid for instance a VM stalling other types (metadata) of IO. The queues are called SchedQ and briefly described by Cormac Hogan here. Of course, there’s a lot more to it than Cormac or I discuss here, but I am not sure how much I can share so I am not going to go there. Either way, if you were used to limits being applied to SvMotion as well you are warned… this is no longer the case.

Secondly, the normalization of I/Os changed with limits. In the past when a limit was applied IOs were normalized at 32KB, meaning that a 64KB I/O would count as 2 I/Os and a 4KB I/O would count as 1. This was confusing for a lot of people and as of vSphere 6.5 this is no longer the case. When you place a limit of 100 IOPS the VMDKs will be limited at 100 IOPS, regardless of the I/O size. This, by the way, was documented here on storagehub, not sure though how many people realized this.

Opvizor Performance Analyzer for vSAN

Duncan Epping · Jul 10, 2018 ·

At a VMUG a couple of months ago I bumped into my old friend Dennis Zimmer. Dennis told me that he was working on something cool for vSAN but couldn’t reveal what it was just yet. Last week I had a call with Dennis about what that thing was. Dennis is the CEO for Opvizor, and some of you may recall the different tooling that Opvizor has produced over the years, of which the Health Analyzer was probably the most famous one back then. I’ve used it in the past on various occasions and I had various customers using it. During the briefing, Dennis explained to me that Opvizor started focussing on performance monitoring and analytics a while ago as the health analyzer market was overly crowded and had the issue that is was a one-off business (checks once in a while instead of daily use). On top of that, many products now come with some form of health analysis included. (See vSAN for instance.) I have to agree with Dennis, so this pivot towards Performance Monitoring makes much sense to me.

Dennis explained to me how they are seeing more and more customer demand for vSAN performance monitoring especially combined with VMware ESXi, VM and App data. Although vCenter has various metrics, and there’s VROps, he told me that Opvizor has many customers who need more than vCenter or vROPS standard has to offer today and don’t own VROps advanced. This is where Opvizor Performance Analyzer comes in to play and that is why today Opvizor announced they are including vSAN specific dashboards. Now, this isn’t just for vSAN of course. Opvizor Performance Analyzer includes not just vSAN but also vSphere and various other parts of the stack. When talking with Dennis one thing became clear, Opvizor is taking a different approach than most other solutions. Where most focus on simplifying, hiding, and aggregating, the focus for Opvizor is on providing as much relevant detail as possible to fulfill the needs of beginner and professional.

So how does it work? Opvizor provides a virtual appliance. You simply deploy it in your environment and connect it to vCenter and you are ready to go. The appliance collects data every 5 minutes (but 20 seconds intervals of these 5 minutes) and has a retention of up to 5 years. As I said, the focus is on infrastructure statistics and performance analytics and as such Opvizor delivers all the data you ever need.

It doesn’t just provide you with all the info you will ever need. It will also allow you to overlay different metrics, which makes performance troubleshooting a lot easier, and will allow you to correlate and pinpoint particular problems. Opvizor comes with dashboards for various aspects, here are the ones included in the upcoming release for vSAN:

  • Capacity and Balance
  • Storage Diskgroup Stats
  • VM View
  • Physical disk latency breakdown
  • Cache Diskgroup stats
  • vSAN Monitor

Now I said this is the expert´s troubleshooting tool, but Opvizor Performance Analyzer also provided in-depth information about what each metric is / means and provides starter dashboards for beginners. You can simply click on the “i” in the top left corner of the widget and you get all the info about that particular widget.

When you do know what you are looking for you can click, hover, and zoom when needed. Hover over the specific section in the graph and the point in time values of the metrics will pop up. In the case below I was drilling down on a VM in the vSAN cluster and looking at write latency in specific. As you can see we have 3 objects and in particular 2 disks and a “vm name space”.

And this is just a random example, there are many metrics to look at and many different widgets and overviews. Just to give you an idea, here are some of the metrics you can find in the UI:

  • Latency (for all different components of the stack)
  • IOPs (for all different components of the stack)
  • Bandwidth (for all different components of the stack)
  • Congestion (for all different components of the stack)
  • Outstanding I/O (for all different components of the stack)
  • Read Cache Hit rate (for all different components of the stack)\
  • ESXi vSAN host disk usage
  • ESXi vSAN host cpu usage
  • Number of Components
  • Disk Usage
  • Cache Usage

And there;s much more, too many to list in this blog. And again, not just vSAN, but there are many dashboards to chose from. If you don’t have a performance monitoring solution yet and you are evaluating solutions like SolarWinds, Turbunomics and others make sure to add Opvizor to that list. One thing I have to say, I spotted a couple of things that I liked to see changed, and I think within 24hrs the Opvizor guys managed to incorporate the feedback. That was a crazy fast turnaround, good to see how receptive they are.

Oh, one more thing I found in the interface, it is these dashboards that deal with things like NUMA. But also things like the Top 10 VMs in terms of IOPS. Both very useful, especially when doing deep performance troubleshooting and optimizing.

I hope that gives you a sense of what they can do. There’s a fully functional 30-day trial, check it out if you want to find out more about Performance Analyzer or simply just want to play around with it. Opvizor announced this brand new version on their own blog here, make sure to give that a read as well!

Adding a fifth (virtual) ESXi host to vCenter Foundation

Duncan Epping · Jul 6, 2018 ·

When running a 4 node stretched cluster environment it should be possible to use “cheaper” vCenter Server licenses, namely vCenter Foundation. One of the limitations of vCenter Foundation is that you can only manage 4 hosts with it. This is where some customers who wanted to manage a stretched cluster hit some issues. The issue occurs at the point where you want to add the Witness VM to the inventory. Deploying the VM, of course, works fine, but it becomes problematic when you add the virtual ESXi host (Witness Appliance) to the vCenter Foundation instance as vCenter simply will not allow you to add a 5th host. Yes, this 5th host would be a witness, and will not be running any VMs, and even has a special license. Yet, the “add host” wizard does not differentiate between a regular host and a virtual witness appliance.

Fortunately, there’s a workaround. It is fairly straightforward, and it has to do with the order in which you add hosts to vCenter Foundation. If you add the witness VM before the physical hosts then the appliance is not counted against the license. The license count (and allocation) apparently happens after the host has been added, but somehow vCenter does validate beforehand. I guess we do this to avoid abuse.

So if you have vCenter Foundation, and want to build a stretched cluster leveraging a 2+2+1 configuration, meaning 4 physical hosts and 1 witness VM, then simply add the Witness VM to the inventory as a host first and then add the rest. For those wondering, yes this is documented in the release notes of vSphere 6.5 Update, all the way at the bottom.

  • « Go to Previous Page
  • Page 1
  • Interim pages omitted …
  • Page 74
  • Page 75
  • Page 76
  • Page 77
  • Page 78
  • Interim pages omitted …
  • Page 497
  • Go to Next Page »

Primary Sidebar

About the Author

Duncan Epping is a Chief Technologist and Distinguished Engineering Architect at Broadcom. Besides writing on Yellow-Bricks, Duncan is the co-author of the vSAN Deep Dive and the vSphere Clustering Deep Dive book series. Duncan is also the host of the Unexplored Territory Podcast.

Follow Us

  • X
  • Spotify
  • RSS Feed
  • LinkedIn

Recommended Book(s)

Also visit!

For the Dutch-speaking audience, make sure to visit RunNerd.nl to follow my running adventure, read shoe/gear/race reviews, and more!

Do you like Hardcore-Punk music? Follow my Spotify Playlist!

Do you like 80s music? I got you covered!

Copyright Yellow-Bricks.com © 2026 · Log in