• Skip to primary navigation
  • Skip to main content
  • Skip to primary sidebar

Yellow Bricks

by Duncan Epping

  • Home
  • Unexplored Territory Podcast
  • HA Deepdive
  • ESXTOP
  • Stickers/Shirts
  • Privacy Policy
  • About
  • Show Search
Hide Search

Server

How cool is TPS?

Duncan Epping · Jan 10, 2011 ·

Frank and I have discussed this topic multiple times and it was briefly mentioned in Frank’s excellent series about over-sizing virtual machines; Zero Pages, TPS and the impact of a boot-storm. Pre-vSphere 4.1 we have seen it all happen, a host fails and multiple VMs need to be restarted. Temporary contention exists as it could take up to 60 minutes before TPS completes. Or of course when the memory pressure thresholds are reached the VMkernel requests TPS to scan memory and collapse pages if and where possible. However, this is usually already too late resulting in ballooning or compressing (if your lucky) and ultimately swapping. If it is an HA initiated “boot-storm” or for instance you VDI users all powering up those desktops at the same time, the impact is the same.

Now one of the other things I also wanted to touch on was Large Pages, as this is the main argument our competitors are using against TPS. Reason for this being that Large Pages are not TPS’ed as I have discussed in this article and many articles before that one. I even heard people saying that TPS should be disabled as most Guest OS’es being installed today are 64Bit and as such ESX(i) will back even Small Pages (Guest OS) by Large Pages and TPS will only add unnecessary overhead without any benefits… Well I have a different opinion about that and will show you with a couple of examples why TPS should be enabled.

One of the major improvements in vSphere 4.0 is that it recognizes zeroed pages instantly and collapses them. I have dug around for detailed info but the best I could publicly find about it was in the esxtop bible and I quote:

A zero page is simply the memory page that is all zeros. If a zero guest physical page is detected by VMKernel page sharing module, this page will be backed by the same machine page on each NUMA node. Note that “ZERO” is included in “SHRD”.

(Please note that this metric was added in vSphere 4.1)

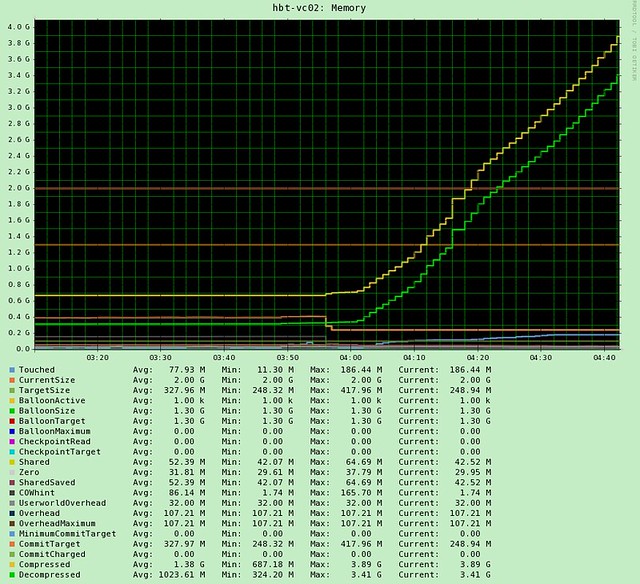
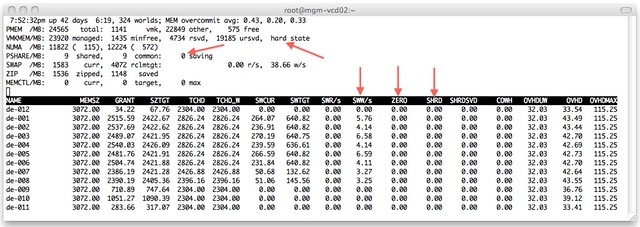
I wondered what that would look like in real life. I isolated one of my ESXi host (24GB of memory) in my lab and deployed 12 VMs with 3GB each with Windows 2008 64-Bit installed. I booted all of them up in literally seconds and as Windows 2008 zeroes out memory during boot I knew what to expect:

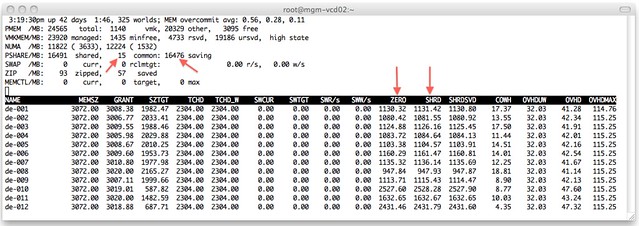
I added a couple of arrows so that it is a bit more obvious what I am trying to show here. On the top left you can see that TPS saved 16476MB and used 15MB to store unique pages. As the VMs clearly show most of those savings are from “ZERO” pages. Just subtract ZERO from SHRD (Shared Pages) and you will see what I mean. Pre-vSphere 4.0 this would have resulted in severe memory contention and as a result more than likely ballooning (if the balloon driver is already started, remember it is a “boot-storm”) or swapping.

Just to make sure I’m not rambling I disabled TPS (by setting Mem.ShareScanGHz to 0) and booted up those 12 VMs again. This is the result:

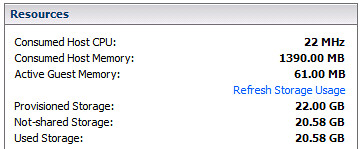
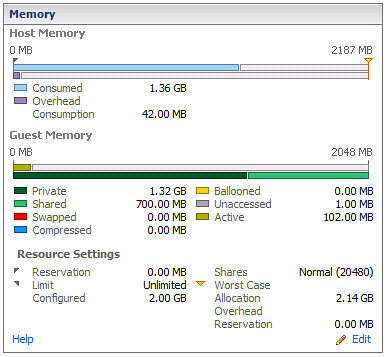
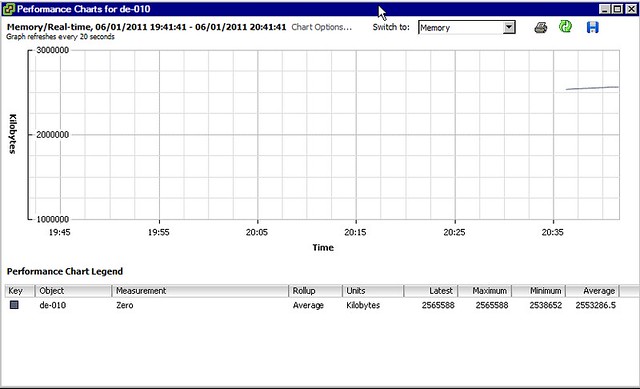
As shown at the top, the hosts status is “hard” as a result of 0 page sharing and even worse, as can be seen on a VM level, most VMs started swapping. We are talking about VMkernel swap here, not ballooning. I guess that clearly shows why TPS needs to be enabled and where and when you will benefit from it. Please note that you can also see “ZERO” pages in vCenter as shown in the screenshot below.

One thing Frank and I discussed a while back, and I finally managed to figure out, is why after boot of a Windows VM the “ZERO” pages still go up and fluctuate so much. I did not know this but found the following explanation:

There are two threads that are specifically responsible for moving threads from one list to another. Firstly, the zero page thread runs at the lowest priority and is responsible for zeroing out free pages before moving them to the zeroed page list.

In other words, when an application / service or even Windows itself “deprecates” the page it will be zeroed out by the “zero page thread” aka garbage collector at some point. The Page Sharing module will pick this up and collapse the page instantly.

I guess there is only one thing left to say, how cool is TPS?!

Top yellow-bricks posts of 2010

Duncan Epping · Dec 30, 2010 ·

My colleague Eric Gray blogged about “VCritical’s” top 10 this morning and I figured why not do the same… here we go:

While many posts from previous years have proven to be evergreen, and among the most heavily trafficked, these are the top posts on Yellow-Bricks published in 2010:

  1. ESXTOP
  2. VMotion, the story and confessions
  3. What’s the point of setting “-iops=1”
  4. VMware vCloud Director
  5. Storage I/O Fairness
  6. vCD Networking – Intro – Part 1
  7. The Resource Pool Priority-Pie Paradox
  8. Limiting your vCPU
  9. Aligning your VMs virtual harddisks
  10. SIOC, tying up some lose ends

My personal favorites:

  1. VMotion, the story and confessions
    I guess I love this one as it isn’t really a tech deepdive but more about how VMware, and in specific Mike Nelson, changed my world and those of many others… Especially the comments make this article a great read!
  2. Re: Maximum Hosts Per Cluster
    This is what I love about blogging, responding to others, voicing your opinion, sharing thoughts / knowledge / expertise… that is what it is all about in my opinion.
  3. ESXTOP
    I love esxtop, there is so much info to be found in esxtop that I never knew where to start. I started documenting some thresholds and by the looks of the stats on this page I wasn’t the only one who needed some guidelines. This page is getting more hits daily than my HA deepdive…

I want to thank everyone for reading yellow-bricks.com and I want to wish all of you a great 2011. See you next year,

HA role promotion…

Duncan Epping · Dec 24, 2010 ·

I received a very valid question this week from someone who bought our book. The question was as follows:

On Page 35 it is mentioned that a Secondary Node is not automatically elected as a Primary if a Primary fails. It then goes on to state the conditions under which this does occur, one of these is if the primary node becomes disconnected from the Cluster. When an ESX host fails doesn’t it always end up in the “disconnected” status, if so why isn’t the role transferred?

This one had me thinking for a couple of minutes as it was 6 months ago that I wrote that section, but I knew I tested this back then. When a host fails it will not receive the status “disconnected” but it will receive the status “not responding”. You can disconnect a host by right clicking it and selected “disconnect from cluster”, that would transfer the role to another node… in the case of “not responding” this doesn’t happen as vCenter is unaware of what happened to the host.

Cool Tool: vmktree

Duncan Epping · Dec 23, 2010 ·

Ever since ESX 2.5 I have always been looking for cool free tools to monitor my hosts. I guess one of the oldest free tools out there is vmktree. Especially in the 2.x timeframe vmktree helped me out solving some weird performance issues. Back then vmktree was still dependent on vmkusage (who remembers that one?) but as of ESX 3.0 vmktree utilizes the api to gather the details needed to plot the graphs.

I lost track of vmktree for a while but when I noticed the announcement this week that 0.4.1 was released I decided to give it a spin again. I logged into my vSphere Management Appliance (vMA) and downloaded vmktree with wget. Installed it following the procedures mentioned in the announcement and literally minutes later I could see the first values coming in. To make sure I had something to show you guys I added a limit of 200MB on a virtual machine. As you know I love esxtop but esxtop are still just “dry numbers” which makes it difficult to see a trend. As you can see in the following screenshot, vmktree makes this trend pretty obvious. (Balloon driver is really active and the size of the balloon is increasing._

Besides memory, of course vmktree has more to offer on both per VM and Host level. For instance on a per VM level you can also see CPU and Storage statistics. On a Host level you can see CPU, Storage and Network. Of course these would include things like Latency, Bus resets, dropped packets, disk space usage… you name it, it is in there.

I know there are a lot of vendors these days offering free monitoring solutions, but the cool thing about vmktree is that it is maintained by just a single person Lars Troen. I can only imagine how much work maintaining a tool like this is. Thanks Lars for helping me out by writing this excellent tool! I would like to ask everyone to give it a try, and of course to provide feedback to Lars so that he can possibly improve vmktree over time.

vCenter and Memory metrics

Duncan Epping · Dec 20, 2010 ·

I received a question last week from a former colleague around vCenter Memory Metrics. There are a couple of places where memory details are shown on a “VM level” within the vCenter client. The first tab that we will discuss is the Summary tab. It shows “General” and “Resources”. It appears that there is a lot of confusion around this topic and that probably comes from the fact that some of the Performance Metrics are named similarly but don’t always refer to the same.

Lets start with “General”:

In the screenshot above you can see 2 fields related to memory:

  • Memory (2048MB)
  • Memory Overhead (110.63MB)

The first one, Memory, is an easy one. This is the amount of memory you provisioned your VM with, in this case 2048MB. The second field is Memory Overhead. Memory Overhead is the amount of memory the VMkernel thinks it will need to run the virtualized workload, in this case 110.63MB. This typicall would include things like page tables, frame buffers etc.

That brings us to the Resources sections:

This section shows again two fields related to memory:

  • Consumed Host Memory (1390.00MB)
  • Active Guest Memory (61.00MB)

Consumed and Active is where it becomes a bit less obvious but again it isn’t rocket science. Consumed Host Memory is the amount of physical memory that has been allocated to the virtual machine. This also includes things like memory overhead, that also means that Consumed can be larger than what has been provisioned. To make it a bit more complex it should be noted that in the “Performance Tab” the “Consumed” Counter doesn’t actually include Memory Overhead!

Active Memory more or less already explains it, it is what the VMkernel believes is currently being actively used by the VM. Now it should be pointed out here that this is an estimate calculated by a form of statistical sampling.

The second tab that contains details around memory is “Resource Allocation”. Looking at the tab I guess it is obvious that this one contains more details and is more complex than the summary tab:

The Memory section contains three sub-sections and I have carved them up as such:

The first section is the host memory:

  • Consumed (1.36GB)
  • Overhead Consumption (42.00MB)

Again, Consumed is the amount of machine memory currently allocated to the VM. In other words, out of the 2GB provisioned currently 1.36GB is being consumed by that VM. The Overhead Consumption is the amount of memory being consumed for the virtualization overhead, as you can see it is less than what the VMkernel expected to use as mentioned in the first screenshot. I guess you could do the math easily:
Consumed = Private + Overhead Consumption

Guest Memory

  • Private (1.32GB)
  • Shared (700.00MB)
  • Swapped (0.00MB)
  • Compressed (0.00MB)
  • Ballooned (0.00MB)
  • Unaccessed (1.00MB)
  • Active (102.00MB)

This is the part where it gets slightly more complicated. Private is the amount of memory that is physically backed by the Host. In other words 1.32GB is physically stored. Shared is the total amount of memory shared by TPS. Swapped, Compressed and Ballooned speak for itself in my opinion but lets be absolutely clear here. Swapped the amount of memory reclaimed by VMkernel swapping, Compressed is the amount of memory stored in the VMs compression cache and Ballooned is the amount of memory reclaimed by the Balloon Driver. Ultimately all of these should be 0.

There’s one which I couldn’t really explain which is Unaccessed. The documentation describes it as “the amount of memory that has never been referenced by the guest”. Active is the amount of memory actively used, again it is an estimate done by statistical sampling. (Did you notice it changed from 61MB to 102MB.)

The last section is Resource Settings, I guess most are obvious (like Reservation, Limit, Configured, Shares) but the two that might not be are:

  • Worst Case Allocation (2.14GB)
  • Overhead Reservation (0.00MB)

Worst Case Allocation is the amount of memory that the virtual machine can allocate when ALL virtual machines consume the full amount of allocated resources. Basically when there is severe overcommitment this is what the VM will get in the worst possible case. This is also one of the key metrics to keep an eye on in my opinion. Especially when you are over-committing and over-provisioning your systems this metric will be a key-indicator. Overhead Reservation is the amount of Overhead Memory reserved, not much to say about that one.

  • « Go to Previous Page
  • Page 1
  • Interim pages omitted …
  • Page 196
  • Page 197
  • Page 198
  • Page 199
  • Page 200
  • Interim pages omitted …
  • Page 336
  • Go to Next Page »

Primary Sidebar

About the Author

Duncan Epping is a Chief Technologist and Distinguished Engineering Architect at Broadcom. Besides writing on Yellow-Bricks, Duncan is the co-author of the vSAN Deep Dive and the vSphere Clustering Deep Dive book series. Duncan is also the host of the Unexplored Territory Podcast.

Follow Us

  • X
  • Spotify
  • RSS Feed
  • LinkedIn

Recommended Book(s)

Also visit!

For the Dutch-speaking audience, make sure to visit RunNerd.nl to follow my running adventure, read shoe/gear/race reviews, and more!

Do you like Hardcore-Punk music? Follow my Spotify Playlist!

Do you like 80s music? I got you covered!

Copyright Yellow-Bricks.com © 2026 ยท Log in