I received a question last week from a former colleague around vCenter Memory Metrics. There are a couple of places where memory details are shown on a “VM level” within the vCenter client. The first tab that we will discuss is the Summary tab. It shows “General” and “Resources”. It appears that there is a lot of confusion around this topic and that probably comes from the fact that some of the Performance Metrics are named similarly but don’t always refer to the same.
Lets start with “General”:

In the screenshot above you can see 2 fields related to memory:
- Memory (2048MB)
- Memory Overhead (110.63MB)
The first one, Memory, is an easy one. This is the amount of memory you provisioned your VM with, in this case 2048MB. The second field is Memory Overhead. Memory Overhead is the amount of memory the VMkernel thinks it will need to run the virtualized workload, in this case 110.63MB. This typicall would include things like page tables, frame buffers etc.
That brings us to the Resources sections:
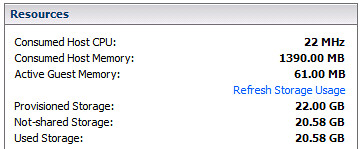
This section shows again two fields related to memory:
- Consumed Host Memory (1390.00MB)
- Active Guest Memory (61.00MB)
Consumed and Active is where it becomes a bit less obvious but again it isn’t rocket science. Consumed Host Memory is the amount of physical memory that has been allocated to the virtual machine. This also includes things like memory overhead, that also means that Consumed can be larger than what has been provisioned. To make it a bit more complex it should be noted that in the “Performance Tab” the “Consumed” Counter doesn’t actually include Memory Overhead!
Active Memory more or less already explains it, it is what the VMkernel believes is currently being actively used by the VM. Now it should be pointed out here that this is an estimate calculated by a form of statistical sampling.
The second tab that contains details around memory is “Resource Allocation”. Looking at the tab I guess it is obvious that this one contains more details and is more complex than the summary tab:
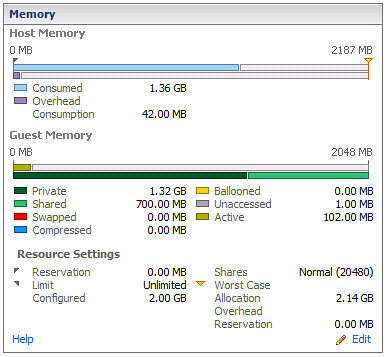
The Memory section contains three sub-sections and I have carved them up as such:
The first section is the host memory:
- Consumed (1.36GB)
- Overhead Consumption (42.00MB)
Again, Consumed is the amount of machine memory currently allocated to the VM. In other words, out of the 2GB provisioned currently 1.36GB is being consumed by that VM. The Overhead Consumption is the amount of memory being consumed for the virtualization overhead, as you can see it is less than what the VMkernel expected to use as mentioned in the first screenshot. I guess you could do the math easily:
Consumed = Private + Overhead Consumption
Guest Memory
- Private (1.32GB)
- Shared (700.00MB)
- Swapped (0.00MB)
- Compressed (0.00MB)
- Ballooned (0.00MB)
- Unaccessed (1.00MB)
- Active (102.00MB)
This is the part where it gets slightly more complicated. Private is the amount of memory that is physically backed by the Host. In other words 1.32GB is physically stored. Shared is the total amount of memory shared by TPS. Swapped, Compressed and Ballooned speak for itself in my opinion but lets be absolutely clear here. Swapped the amount of memory reclaimed by VMkernel swapping, Compressed is the amount of memory stored in the VMs compression cache and Ballooned is the amount of memory reclaimed by the Balloon Driver. Ultimately all of these should be 0.
There’s one which I couldn’t really explain which is Unaccessed. The documentation describes it as “the amount of memory that has never been referenced by the guest”. Active is the amount of memory actively used, again it is an estimate done by statistical sampling. (Did you notice it changed from 61MB to 102MB.)
The last section is Resource Settings, I guess most are obvious (like Reservation, Limit, Configured, Shares) but the two that might not be are:
- Worst Case Allocation (2.14GB)
- Overhead Reservation (0.00MB)
Worst Case Allocation is the amount of memory that the virtual machine can allocate when ALL virtual machines consume the full amount of allocated resources. Basically when there is severe overcommitment this is what the VM will get in the worst possible case. This is also one of the key metrics to keep an eye on in my opinion. Especially when you are over-committing and over-provisioning your systems this metric will be a key-indicator. Overhead Reservation is the amount of Overhead Memory reserved, not much to say about that one.
wow this is what i need! thx
Hi
but as i understand consumed can change constantly..i mean that if there is memory available on the host i’m expecting consumed to be higher ?
am i right?
thx
Yes, consumed is what it is using right now… could change every second.
Hi Duncan,
Great article
Im new to vmware and trying to understand\learn how the memory techniques work…
You say : “Yes, consumed is what it is using right now… could change every second.”
I read that the hypervisor is unaware of memory pages that the VM “puts on its free list”
Based on above how can the consumed host memory change up and down?
Regards
Johan
Read my latest article on TPS and zeroed pages.
So the answer to why i can see that the “consumed host memory” is changing up and down is :
“In other words, when an application / service or even Windows itself “deprecates” the page it will be zeroed out by the “zero page thread” aka garbage collector at some point. The Page Sharing module will pick this up and collapse the page instantly.”
Correct?
Regards
Johan
Isn’t the “Unaccessed” description just what it says?
The reason this is quite low on Windows is due to the fact that Windows seems to touch (zero?) every memory page that it can see on boot. Linux does not do this, so you get higher values for “Unaccessed” on Linux VMs. I can’t find any Windows VMs in our farm with more than 1MB for Unaccessed, but we have one or two Linux VMs with up to 1GB there.
This would be important when setting memory reservations due to their “non-reclaimable” nature, I think.
Clarity. I love this. Thank you!
I had seen a situation the active guests memory shown in vCenter did not match with the operating system level, which on OS level, the memory shown 90% utilized, but in vcenter, it only showed 10% utilize.
Any advice on this?
Craig:
This is the biggest mistake people make when analyzing memory. Active does not mean consumed. Windows itself has no way of telling you how much is actually “active”. It will show you consumed.
VMware will tell you how much memory is *actively* being accessed.
In other words, sure you might assign 2GB of RAM and there is 1.5 consumed (what Windows will show you), but active is only about 400MB. You could theoretically get away with assignon less physical memory and deal with page file usage in the guest – the actual paging may not be as much as you might think – you’d have to watch it to find out if the disk activity and performance impact makes a notable difference.
Don’t look at it with exchange server virtualized. Exchange cached the ram and VMware will not count it in “Active” memory. In result, VMWare might shared that ram with other VM’s which will result in a high paging and really slow operation from the exchange server…
Excellent post Duncan!
One question – about the guest memory stats like swapped, compressed, ballooned, and unaccessed you say that “Ultimately all of these should be 0.”
Why should they all be zero?
Thanks,
David
Good article Duncan, if for no other reason to provide a quickly accessible and consistent reference. I agree there is some confusion and misuse of VMware’s memory metrics which I’ve witnessed first hand. It boils down to knowing the library of memory terminology VMware has defined and more importantly knowing the meaning (calculation) behind each of them. It’s not difficult to forget these when one does not use the information on a regular basis. It depends somewhat on your job role and the amount of time you spend per day troubleshooting or monitoring a VMware environment. I sometimes lose track of the more obscure vCenter statistics which is why I keep a copy of the VMware white paper which defines them all at my desk as well as on my frequently used USB drive I wear around my neck. It would be helpful if VMware could provide the definition of vCenter metrics during a mouse hover. These definitions are and always have been provided in the vSphere Client, performance tab, advanced button, chart options hyperlink.
Good feedback Jason, let me see what I can do about that.
David:
Likely because if you’re swapping, using compression or ballooning it means the host is running out of physical memory resources – never a good idea to run like that.
Unaccessed memory at zero likely means that you have more memory assigned then is actually necessary. The guest is simply not using some of the memory, so why have it assigned?
Therefore all of the metrics at or near zero is the ideal situation in order to ensure optimal performance – from the perspective of memory.
Thanks for great information; I do have a question on always confusing discussion.
If at some point guest operating system used up all of the allocated memory say 2GB, at that time the consumed memory should show 2GB (ignoring the overhead for clarity).
If the guest OS then freed 1.5 GB and since the host does not no when the guest “frees” the memory, would consumed memory at that time would show 500 MB or would it still show 2GB?
Regards
We just completed a white paper on memory along with VMware. Pages 4-6 explain the memory metrics in more detail. I hope this helps.
http://www.yellow-bricks.com/2010/12/20/vcenter-and-memory-metrics/
Oops. Wrong link. Here is the white paper’s link 🙂
http://www.kingston.com/channelmarketingcenter/oemspecific/literature/MKP_339_VMware_vSphere4.0_whitepaper.pdf
@David : As Swapping / Ballooning / Compressing means performance degradation eventually!
@Sachin: Correct, but keep in mind that it is “private” memory only… so non-shared physical memory.
Hello Duncan,
Could you please explain the private memory a bit more .. as what is the formula we could use to calculate private memory for a virtual machine in ESX server.
You cannot calculate it your self, you can guess by applying something like:
(Total amount of VM memory – percentage used) – 35% TPS reduction + overhead.
Something like that, but it would still be very much guessing.
Duncan,
Thanks for the response, so would it show 500MB or still show 2GB as consumed memory (since at one point guest had used that)?
Regards,
It depends, if it is consuming 500MB worth of phys pages it will be that value, if it is 2000… As stated, ESX is not aware of mem pages that are marked as “obsolete”.
Nice article Duncan, exactly the quality we’ve all come to expect from you 🙂
Perhaps its worth mentioning the rollups that are available (Maximum, Minimum, Average). I’ve come across a fair bit of confusion regarding these and they seem very handy when looking at peaky load types, SQL servers for instance.
The difference between “maximum of averages(recorded over 5min intervals)”, “Maximum of Maximums(recorded over 5minute intervals)” and “Average of Maximums” is pretty substantial in some cases.
-Doug
@Ceri Davies: Correct, Windows zeroes out memory on boot hence the reason it is low. Not sure why it is 1MB and where that 1MB of unzeroed out memory comes from though, maybe it includes the overhead as well.
Hi Duncan,
Thanks for the post, but this seems to all change with the nehalem processor. The consumed memory always shows slightly lower than the memory granted. We have found in all our clusters that have the nehalem, the VM memory metrics do us no good at all to understand how much is being used. We have to rely on an actual monitoring product to get us proper memory metrics.
Michael, you bring up something that I’ve been seeing more and more lately as people upgrade to vSphere and buy newer hardware. This is something that has been weighing on my mind a bit and I’d be curious to see what others think.
Basically, when the new Nehalem procs are used in conjunction with vSphere, “Large Memory Pages” gets enabled by default. This is a nice performance boost (20-25%), but turns memory consumed into a fairly obsolete metric. In essence, every VM starts looking like a SQL Server (i.e. grabbing all available memory). Because of this, memory active becomes your primary performance metric for understanding what a VM is using.
When using large memory pages, following memory consumed would never allow you to over-commit memory resources, which is extreme and diminishes VM density. To magnify this diminished density even more, until you start to over-commit resources and the host feels it needs the resources, TPS will not kick into effect. Lastly, ballooning suddenly isn’t necessarily a bad thing (swapping is still bad). Because every VM is claiming everything it has been allocated, ballooning is the only way for the host to get back the resources that are not actively being used.
Does this sound correct? Anything I’m missing?
Not sure I follow you Jonathan. Hosts can still be overcommited when ever you desire and as soon as they are large pages will be broken up in to small pages and using the “tps hints” they will rapidly be collapsed.
You can disable this behavior by the way, you can disable the usage of large pages if you want. I wouldn’t recommend it, but it is possible.
The ESX4/Nehalem/TPS behavior is taking some time to get comfortable with. I’m not there yet.
Clustered hosts that had averaged 50% memory usage before an ESX upgrade now average 70%. Hosts regularly pop above 90% memory utilization until either VMotion or TPS bring that back down. CapacityIQ (ver 1.0) is showing trends that are hard to interpret, if you trust that there are potential TPS memory savings that can be recovered before ballooning or swapping occur. (They were there under ESX 3.51, and cluster membership stayed stable through the upgrade to ESX 4.)
If you can’t measure it you can’t manage it, and right now it feels like I can’t measure memory performance and over-commit benefits sufficiently for capacity planning. Correlating hundreds of in-guest metrics doesn’t even help with potential TPS, and http://kb.vmware.com/kb/1020524 doesn’t say whether the host calculations that feed into break up into smaller pages (tps hints?) are available to view.
So, I’m still struggling with this performance improvement.
Yeah, I wouldn’t recommend disabling large memory pages either. I think Joe’s response (below) helps to illustrate some of the concerns we’re seeing while trying to get “comfortable” with large memory pages.
How does one know when overcommitment levels are bad/good? Many times things may appear bad (90% usage), but hosts may be just reaching the point where it will start using TPS, which isn’t a bad thing. Also, sometime after TPS kicks in, won’t ballooning eventually kick in to reclaim much of the memory pages that were originally claimed due to large memory pages and give them to other VMs that need them more? In this case, ballooning isn’t something that should be a concern, correct?
In order to know what is actually used you will need to monitor in-guest and not outside of the guest.
With Nehalem indeed this became “worse” as Large Pages will be used with specific OS’s and they will not be TPSed by unless there is contention. Meaning that is seems like your Hosts are reaching the end….
@Michael
If you’re looking at the performance graphs (like the advanced performance graphs), consumed = memory granted – memory shared.
Try showing the grpah with the granted, consumed, and shared memory metrics. You might have to do it in real time unless you’ve got your logging turned up enough to keep all the particular stats. When these metrics are displayed, shared + consumed = granted, it should be fairly simple math for any particular data point.
We consistently experience Windows 2003/2008 guests which show very low Consumed Host Memory but still experience in-guest paging and very high in-guest “metrics” for memory currently in use. Any tips on tracking this down? It is not due to ballooning.
If it requires explaining, perhaps a better way to display the data is something that needs to be revisited.
All I can say is: we are working on it 🙂
All, I’m new to VMware I would like to know the techniques or metrics that when can I say to my Infra admin that VM allocated to my app is not having adequate memory or it needs an additional memory.
I had glance at past year memory average utilization where my system is utilized on and avg 10% and for your information the allocated mem is 8G. However my consumed mem always consistent above 6G.
Can someone explain , since I always an argument with my sysadmin on this and he yells by showing mem avg utilization
HiDuncan
Does these metrics still apply to esxi 5 or are there any changes which we should be aware of?
Thanks
One place you can have unaccessed memory on a Windows VM is if someone assigns 4GB of RAM to a 32 bit VM and forgets to set the /3GB switch.
Alex – I think you mean in server 2003 putting /PAE in the boot.ini otherwise Windows only uses 3.25Gb
Excellent article and discussion!
Is there a way to get all that rich info from the vCenter API?
Thanks
Hi Duncan,
Im new to VMware and try to learn memory technique. as i gone through the article bit confused. consumed memory is provisoined to VM + overhead memory. but this is in my lab shows very less. say 10GB provisioned , overhead 300MB. but in Consumed memory tab shows 5GB.. how this possible?
second thing. if you explain the below case, i will be some more clear about that
Provisioned:12GB
consumed:9.76GB
overhead:207MB
guest memory TAB
Private:9.76GB
shared:1.18GB
Balooned:1.06GB
Activ:1.09GB
the machine has 12GB memory and running one VM 2008 server. it trigers Host memory alarms. plase help to understand
Hi,
on one of my VMs I have observed that Active memory was higher that Granted resp. Consumed. Please how is it possible? I have 1GB memory CentOS VM and I observed that it had 750 MB Active and 432 MB Granted and 430 MB Consumed. Please explain how is it possible.
Thank you.
Hey Duncan, can you explain the difference between usage (%) and the other metrics?
Hey Duncan,
I have a doubt in the memory overhead part. It is high before i start a VM and then it comes down to a lower size after some time. Why is it reducing? And why is it high during startup? Can u please explain about the memory overhead in detail?
Private: Amount of memory backed by host memory and not being shared. What does it means? The memory ESX host taken back? or the memory reserved for the guest and not sharing with any other VM? Because, the consumed memory is combination of private+Overhead consumption so what is private memory doing here when active memory is very less?
I’m confused with private memory 🙁
Fantastic article. Stumbled on this gem after some serious googling effort.
question though: i got a VM with 32G memory *reserved*
When i look at Consumed Host Memory on ‘Resources’ tab under ‘Summary’ pane I see:17.6 G
The article says: Consumed Host Memory is the amount of physical memory that has been allocated to the virtual machine.
Does that mean -Yes I have got 32G reserved on my VM; but as of this minute VMkernel has only allocated 17.6 G. It can further allocate based on my memory usage.. Is that correct?
Secondly, Active Guest Memory on ‘Resources’ tab under ‘Summary’ shows 1.3 G
But when I do a free -m from the VM OS:
free -m
total used free shared buffers cached
Mem: 32059 6031 26027 0 2247 846
-/+ buffers/cache: 2937 29121
As you can see: 6G (used) – (buffers + cache –> 2247 + 846) =~2.9G
So i wonder why there is a mismatch of 1.6 G
Hi Duncan,
When we look at swapped is 0. Then in the datastore the size of vswp file is =allocation-reservation. Which is correct?
The swap file is always pre-provisioned so it will be allocation-reservation even when swapped = 0.
Thank you!
Hi Duncan,
Thank you for your valuable article, According to your equation “Consumed = Private + Overhead Consumption”, I got this problem on a win XP VM
VM allocated memory =256 MB.
consumed= 265 MB
overhead = 22 MB
But Private memory shows 237 MB
So according to your equation private memory should be 243 MB, what has happened to the lost 6 MB ?
Also this VM has shared 20 MB
thank you
Excellent. Wouldn’t provisioned memory of 2048MB for VM which is more then consumed host memory of 1390MB mean memory over commitment??
Nice one, can you share the similar doc for CPU pls ?
Nice one, can you share the similar doc for CPU pls ?