• Skip to primary navigation
  • Skip to main content
  • Skip to primary sidebar

Yellow Bricks

by Duncan Epping

  • Home
  • Unexplored Territory Podcast
  • HA Deepdive
  • ESXTOP
  • Stickers/Shirts
  • Privacy Policy
  • About
  • Show Search
Hide Search

Software Defined

My top VMworld session picks

Duncan Epping · Aug 7, 2018 ·

Every year I post a list of my favorite VMworld sessions, my top picks. There are way too many sessions to see, but these are definitely the sessions I would like to attend personally. That could be because of the speaker, or the content, and preferably both. Yes I know, this list will have some great sessions missing, not because I did not like the abstract or speaker, but simply because I forced myself to limit this list to 10. Before we get started, here are the two sessions I have scheduled, make sure to sign up for those while you still can, as both seem to be at 80+ % capacity right now

  1. The Power of Storage Policy-Based Management [HCI1270BU] – Cormac Hogan & Duncan Epping
    Tuesday, Aug 28, 12:30 p.m. – 1:30 p.m.
    The world of software-defined storage moves at a rapid pace, and VMware is one of the biggest enablers. In this session, Cormac and Duncan will guide you through the world of software-defined storage initiatives at VMware and provide a primer to VMware vSAN, VMware Virtual Volumes (VVol), persistent cloud-native storage options (Project Hatchway), the VMware vSphere APIs for I/O filtering, and the binding factor in these cases: storage policy-based management. Be warned: We will bring demos!
  2. vSphere Clustering Deep Dive, Part 1: vSphere HA and DRS [VIN1249BU] – Frank Denneman & Duncan Epping
    Monday, Aug 27, 12:30 p.m. – 1:30 p.m.
    In this session, Duncan and Frank will take you through the trenches of VMware vSphere Distributed Resource Scheduler (DRS) and vSphere High Availability (HA). Find out about options to optimize your DRS settings for your specific requirements and goals, such as if you should be load balancing on active or consumed memory, as well as what has recently changed in the DRS algorithm and if it will impact DRS behavior. And for vSphere HA, you will learn about when it restarts virtual machines (VMs), what kind of restart times to expect, and where you can find evidence that a VM (or multiple) have been restarted. You will find out about all of these items and more. Prepare to dive deep, as the basics will not be covered.

Here are my top picks, note that although I picked Ravi’s session from the Extreme Performance Series, all of them are worth attending!

  1. Extreme Performance Series: vCenter Performance Deep Dive [VIN1759BU] Ravi Soundararajan
    Tuesday, Aug 28, 5:00 p.m. – 6:00 p.m.
    In this talk, you will get a brief description of the internals of VMware vCenter before going into basic performance troubleshooting and monitoring techniques. Find out about various tools for analyzing resource usage, important metrics like sessions and API calls, and database performance (primarily for the vCenter Server Appliance, but also for vCenter Server for Windows). You will get to understand the differences between vCenter and Platform Services Controller, and consider the impact of linked mode and plug-ins/extensions. By the end of the talk, you’ll understand how your vCenter works, when you may need multiple vCenters, and how Platform Services Controller factors into performance. xPerfSeries
  2. Tech Preview: The Road to a Declarative Compute Control Plane [VIN2256BU] Maarten Wiggers & Frank Denneman
    Tuesday, Aug 28, 12:30 p.m. – 1:30 p.m.
    Declarative control planes are becoming increasingly popular in the industry. Instead of explicitly defining configurations, declarative control planes tell the architecture what the desired state should be. The desired state could be high priority, or keep particular VMs or containers separate. Within the software-defined data center (SDDC), VMware vSphere offers two declarative control planes: one for networking and one for storage. However, there is no declarative control plane for compute yet.
    Compute policy provides a framework to allow our customers the flexibility and control of VM placement and resourcing decisions based on the user’s encompassing application needs. In this session, you will learn about the capabilities introduced in the VMware Cloud SDDC as a path to achieve that goal.
  3. Clustering Deep Dive 2: Quality Control with DRS and Network I/O Control [VIN1735BU] Niels Hagoort & Sahan Gamage
    Tuesday, Aug 28, 2:00 p.m. – 3:00 p.m.
    In this session, you will go through the trenches of network-aware VMware vSphere DRS and vSphere Network I/O Control. You may ask yourself what these two have to do with each other as, unfortunately, not many people know about the enhancements added to the DRS algorithm around network-aware load balancing. If you want to understand how this can help prevent problems from occurring with network-intensive workloads like NFV, then this is a session you cannot miss!
  4. Project Fractal – The Easy Button for Edge Computing [IOT2593BU] – Dennis Lu & Sridevi Ravuri
    Tuesday, Aug 28, 4:00 p.m. – 5:00 p.m.
    Come and learn about how VMware can accelerate your adoption of Edge Computing by dealing with the additional complexity and cost of infrastructure management at the Edge, helping you quickly achieve the cost savings and revenue growth benefits of Edge Computing. This is also a great opportunity to shape the direction of VMware’s edge services to help fit customer needs.
  5. vSAN Deployment Topology and Availability Deep Dive: What You Need to Know [HCI2040BU] Paudie O’Riordan & Mansi Shah
    Wednesday, Aug 29, 8:00 a.m. – 9:00 a.m.
    Today, VMware vSAN can be deployed in many different form factors; for example, vSAN 2-Node ROBO, vSAN Fault domains, Stretch Cluster with and without local protection, and more. These deployment models make vSAN quite flexible and unique. This session will help you understand the different trade-offs and focus on the benefits and overheads of the choice you’ve made in your vSAN proposed design. Join Mansi and Paudie as they discuss these topologies in depth from both an engineering perspective and a practical real-world implementation. Paudie and Mansi will take a no-nonsense review of how to approach designing a fault-tolerant vSAN deployment and give real-world examples of how to achieve the best design from both an availability and performance perspective.
  6. Top 10 Automation Requests and How You Can Save Time [VIN2527BU] Alan Renouf & William Lam
    Monday, Aug 27, 2:00 p.m. – 3:00 p.m.
    After working firstly as customers and secondly at VMware, Alan and William have encountered hundreds of ways to save time through automation. In this session, they will take you through the top automation requests and how they were completed, teaching you not only how to reproduce them yourself, but also giving you a framework to enable you to automate your top 10 requests.
    This session will include a number of techniques and languages, such as PowerShell, PowerCLI, Python, Java, .NET, and simple web applications with JavaScript.
  7. Data Lifecycle Management in Hybrid Clouds [HCI1705BU] Christos Karamanolis & Ilya Languev
    Tuesday, Aug 28, 2:00 p.m. – 3:00 p.m.
    The focus of IT and DevOps organizations is shifting from storage toward data management independent of infrastructure and locations. This trend is partly driven by a new generation of applications that extract business value from data (big data, analytics, machine learning). Customers need cost-effective data storage but also data mobility, copy management, and on-demand access as business requirements and IT investments evolve. Join Christos Karamanolis (CTO, Storage and Availability) and Ilya Languev (Principal Engineer) as they outline the VMware vision around data lifecycle management that spans private data centers and public clouds. They will discuss VMware’s R&D investments in this space and use real-world examples and demos to highlight the benefits for our customers, both for traditional and cloud-native applications.
  8. VMware CTO Panel: What’s Over the Horizon? [CTO3496PU] Ray O’Farrell, Christos Karamanolis, Chris Wolf, Shawn Bass, Pere Monclus
    Tuesday, Aug 28, 5:30 p.m. – 6:30 p.m.
    VMware CTOs spend significant time assessing emerging technology trends, taking a practical look at their potential impacts and opportunities for VMware. This session explores emerging areas, inclusive of edge, the Internet of things, artificial intelligence (AI)/machine learning (ML), SD-WAN and network service mesh, distributed data management, and more. There will also be ample time for you to have your most pressing questions answered.
  9. Smart Placement of Workloads in Tomorrow’s Distributed Cloud [CTO2161BU] Daniel Beveridge
    Tuesday, Aug 28, 1:00 p.m. – 2:00 p.m.
    This session will offer a look at the evolution of cloud as we move from a nega-cloud-focused experience into a more distributed cloud experience where compute evolves toward a mesh of resources. Find out about a technology project sponsored by VMware’s Office of the CTO that has developed a novel approach to the placement of workloads in a vast marketplace of providers, resulting in a seamless cloud burst experience across a range of providers. You will learn about some cutting-edge cloud technology that points toward a new way of consuming cloud services with an emphasis on reducing cost, improving user experience, and offering increased flexibility and agility in workload management.
  10. Optimizing vSAN for Performance [HCI1246BU] Cormac Hogan & Paudie O’Riordan
    Tuesday, Aug 28, 3:30 p.m. – 4:30 p.m.
    The VMware vSAN team gets many questions on performance. For example, does adding a second disk group improve performance? Does adding a stripe width to an object make things faster? Does increasing the MTU size matter? Does mixing SAS and SATA make a difference? Join this session for answers to these sorts of questions. Paudie and Cormac will discuss the results of various performance tests they initiated in their labs to reach these conclusions. You will learn about the benchmark tool of choice, HCIBench, as well as all the different nuances that can make a difference to your benchmarking results.

Also note, there’s a long list of “deep dive” session at vmworld this year, do a search and register before it is too late!

Opvizor Performance Analyzer for vSAN

Duncan Epping · Jul 10, 2018 ·

At a VMUG a couple of months ago I bumped into my old friend Dennis Zimmer. Dennis told me that he was working on something cool for vSAN but couldn’t reveal what it was just yet. Last week I had a call with Dennis about what that thing was. Dennis is the CEO for Opvizor, and some of you may recall the different tooling that Opvizor has produced over the years, of which the Health Analyzer was probably the most famous one back then. I’ve used it in the past on various occasions and I had various customers using it. During the briefing, Dennis explained to me that Opvizor started focussing on performance monitoring and analytics a while ago as the health analyzer market was overly crowded and had the issue that is was a one-off business (checks once in a while instead of daily use). On top of that, many products now come with some form of health analysis included. (See vSAN for instance.) I have to agree with Dennis, so this pivot towards Performance Monitoring makes much sense to me.

Dennis explained to me how they are seeing more and more customer demand for vSAN performance monitoring especially combined with VMware ESXi, VM and App data. Although vCenter has various metrics, and there’s VROps, he told me that Opvizor has many customers who need more than vCenter or vROPS standard has to offer today and don’t own VROps advanced. This is where Opvizor Performance Analyzer comes in to play and that is why today Opvizor announced they are including vSAN specific dashboards. Now, this isn’t just for vSAN of course. Opvizor Performance Analyzer includes not just vSAN but also vSphere and various other parts of the stack. When talking with Dennis one thing became clear, Opvizor is taking a different approach than most other solutions. Where most focus on simplifying, hiding, and aggregating, the focus for Opvizor is on providing as much relevant detail as possible to fulfill the needs of beginner and professional.

So how does it work? Opvizor provides a virtual appliance. You simply deploy it in your environment and connect it to vCenter and you are ready to go. The appliance collects data every 5 minutes (but 20 seconds intervals of these 5 minutes) and has a retention of up to 5 years. As I said, the focus is on infrastructure statistics and performance analytics and as such Opvizor delivers all the data you ever need.

It doesn’t just provide you with all the info you will ever need. It will also allow you to overlay different metrics, which makes performance troubleshooting a lot easier, and will allow you to correlate and pinpoint particular problems. Opvizor comes with dashboards for various aspects, here are the ones included in the upcoming release for vSAN:

  • Capacity and Balance
  • Storage Diskgroup Stats
  • VM View
  • Physical disk latency breakdown
  • Cache Diskgroup stats
  • vSAN Monitor

Now I said this is the expert´s troubleshooting tool, but Opvizor Performance Analyzer also provided in-depth information about what each metric is / means and provides starter dashboards for beginners. You can simply click on the “i” in the top left corner of the widget and you get all the info about that particular widget.

When you do know what you are looking for you can click, hover, and zoom when needed. Hover over the specific section in the graph and the point in time values of the metrics will pop up. In the case below I was drilling down on a VM in the vSAN cluster and looking at write latency in specific. As you can see we have 3 objects and in particular 2 disks and a “vm name space”.

And this is just a random example, there are many metrics to look at and many different widgets and overviews. Just to give you an idea, here are some of the metrics you can find in the UI:

  • Latency (for all different components of the stack)
  • IOPs (for all different components of the stack)
  • Bandwidth (for all different components of the stack)
  • Congestion (for all different components of the stack)
  • Outstanding I/O (for all different components of the stack)
  • Read Cache Hit rate (for all different components of the stack)\
  • ESXi vSAN host disk usage
  • ESXi vSAN host cpu usage
  • Number of Components
  • Disk Usage
  • Cache Usage

And there;s much more, too many to list in this blog. And again, not just vSAN, but there are many dashboards to chose from. If you don’t have a performance monitoring solution yet and you are evaluating solutions like SolarWinds, Turbunomics and others make sure to add Opvizor to that list. One thing I have to say, I spotted a couple of things that I liked to see changed, and I think within 24hrs the Opvizor guys managed to incorporate the feedback. That was a crazy fast turnaround, good to see how receptive they are.

Oh, one more thing I found in the interface, it is these dashboards that deal with things like NUMA. But also things like the Top 10 VMs in terms of IOPS. Both very useful, especially when doing deep performance troubleshooting and optimizing.

I hope that gives you a sense of what they can do. There’s a fully functional 30-day trial, check it out if you want to find out more about Performance Analyzer or simply just want to play around with it. Opvizor announced this brand new version on their own blog here, make sure to give that a read as well!

Adding a fifth (virtual) ESXi host to vCenter Foundation

Duncan Epping · Jul 6, 2018 ·

When running a 4 node stretched cluster environment it should be possible to use “cheaper” vCenter Server licenses, namely vCenter Foundation. One of the limitations of vCenter Foundation is that you can only manage 4 hosts with it. This is where some customers who wanted to manage a stretched cluster hit some issues. The issue occurs at the point where you want to add the Witness VM to the inventory. Deploying the VM, of course, works fine, but it becomes problematic when you add the virtual ESXi host (Witness Appliance) to the vCenter Foundation instance as vCenter simply will not allow you to add a 5th host. Yes, this 5th host would be a witness, and will not be running any VMs, and even has a special license. Yet, the “add host” wizard does not differentiate between a regular host and a virtual witness appliance.

Fortunately, there’s a workaround. It is fairly straightforward, and it has to do with the order in which you add hosts to vCenter Foundation. If you add the witness VM before the physical hosts then the appliance is not counted against the license. The license count (and allocation) apparently happens after the host has been added, but somehow vCenter does validate beforehand. I guess we do this to avoid abuse.

So if you have vCenter Foundation, and want to build a stretched cluster leveraging a 2+2+1 configuration, meaning 4 physical hosts and 1 witness VM, then simply add the Witness VM to the inventory as a host first and then add the rest. For those wondering, yes this is documented in the release notes of vSphere 6.5 Update, all the way at the bottom.

How to simplify vSAN Support!

Duncan Epping · May 25, 2018 ·

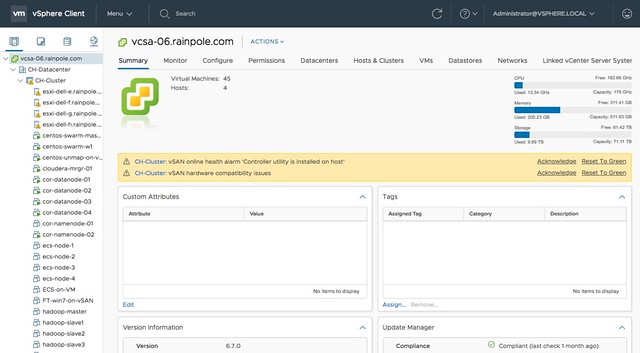
Last week I presented at the Tech Support Summit in Cork with Cormac. Our session was about the evolution of vSAN, where are we today but more importantly which directly will we be going. One thing that struck me when I discussed vSAN Support Insight, the solution we announced not to long ago, is that not too many people seemed to understand the benefit. When you have vSAN and you enable CEIP (Customer Experience Improvement Program) then you have a phone home solution for your vSphere and vSAN environment automatically. What this brings is fairly simple to explain: less frustration! Why? Well the support team will have, when you provide them your vCenter UUID, instant access to all of the metadata of your environment. What does that mean? Well the configuration for instance, the performance data, logs, health check details etc. This will allow them to instantly get a good understanding of what your environment looks like, without the need for you as a customer to upload your logs etc.

At the event I demoed the Support Insight interface, which is what the Support Team has available, and a lot of customers afterwards said: now I see the benefit of enabling this, I will do this for sure when I get back to the office. So I figured I would take the demo, do a voice over and release it to the public. We need more people to join the customer experience improvement program, so watch the video to see what this gives the support team. Note by the way that everything is anonymized, without you providing a UUID it is not possible to correlate the data to a customer. Even when you provide a UUID the support team can only see the host, vm, policy and portgroup (etc) names when you provide them with what is called an obfuscation map (key). Anyway, watch the demo and join now!

What’s new vSAN 6.7

Duncan Epping · Apr 17, 2018 ·

As most of you have seen, vSAN 6.7 just released together with vSphere 6.7. As such I figured it was time to write a “what’s new” article. There are a whole bunch of cool enhancements and new features, so let’s create a list of the new features first, and then look at them individually in more detail.

  • HTML-5 User Interface support
  • Native vRealize Operations dashboards in the HTML-5 client
  • Support for Microsoft WSFC using vSAN iSCSI
  • Fast Network Failovers
  • Optimization: Adaptive Resync
  • Optimization: Witness Traffic Separation for Stretched Clusters
  • Optimization: Preferred Site Override for Stretched Clusters
  • Optimization: Efficient Resync for Stretched Clusters
  • New Health Checks
  • Optimization: Enhanced Diagnostic Partition
  • Optimization: Efficient Decomissioning
  • Optimization: Efficient and consistent storage policies
  • 4K Native Device Support
  • FIPS 140-2 Level 1 validation

Yes, that is a relatively long list indeed. Lets take a look at each of the features. First of all, HTML-5 support. I think this is something that everyone has been waiting for. The Web Client was not the most loved user interface that VMware produced, and hopefully the HTML-5 interface will be viewed as a huge step forward. I have played with it extensively over the past 6 months and I must say that it is very snappy. I like how we not just ported over all functionality, but also looked if workflows could be improved and if presented information/data made sense in each and every screen. This also however does mean that new functionality from now on will only be available in the HTML-5 client, so use this going forward. Unless of course the functionality you are trying to access isn’t available yet, but most of it should be! For those who haven’t seen  it yet, here’s  a couple of screenshots… ain’t it pretty? 😉

For those who didn’t notice, but in the above screenshot you actually can see the swap file, and the policy associated with the swap file, which is a nice improvement!

The next feature is native vROps dashboards for vSAN in the H5 client. I found this very useful in particular. I don’t like context switching and this feature allows me to see all of the data I need to do my job in a single user interface. No need to switch to the VROps UI, but instead vSphere and vSAN dashboards are now made available in the H5 client. Note that it needs the VROps Client Plugin for the vCenter H5 UI to be installed, but that is fairly straight forward.

Next up is support for Microsoft Windows Server Failover Clustering  for the vSAN iSCSI service. This is very useful for those running a Microsoft cluster. Create and iSCSI Target and expose it to the WSFC virtual machines. (Normally people used RDMs for this.) Of course this is also supported with physical machines. Such a small enhancement, but for customers using Microsoft clustering a big thing, as it now allows you to run those clusters on vSAN without any issues.

Next are a whole bunch of enhancements that have been added based on customer feedback of the past 6-12 months. Fast Network Failovers was one of those. Majority of our customers have a single vmkernel interface with multiple NICs associated with them, some of our customers have a setup where they create two vmkernel interfaces on different subnets, each with a single NIC. What that last group of customers noticed is that in the previous release we waited 90 seconds before failing over to the other vmkernel interface (tcp time out) when a network/interface had failed. In the 6.7 release we actually introduce a mechanism that allows us to failover fast, literally within seconds. So a big improvement for customers who have this kind of network configuration (which is very similar to the traditional A/B Storage Fabric design).

Adaptive Resync is an optimization to the current resync function that is part of vSAN. If a failure has occurred (host, disk, flash failure) then data will need to be resynced to ensure that the impacted objects (VMs, disks etc) are brought in to compliance again with the configured policy. Over the past 12 months the engineering team has worked hard to optimize the resync mechanism as much as possible. In vSAN 6.6.1 a big jump was already made by taking VM latency in to account when it came to resync bandwidth allocation, and this has been further enhanced in 6.7. In 6.7 vSAN can calculate the total available bandwidth, and ensures Quality Of Service for the guest VMs prevails by allocating those VMs 80% of the available bandwidth and limiting the resync traffic to 20%. Of course, this only applies when congestion is detected. Expect more enhancements in this space in the future.

A couple of release ago we introduced Witness Traffic Separation for 2 Node configurations, and in 6.7 we introduce the support for this feature for Stretched Clusters as well. This is something many Stretched vSAN customers have asked for. It can be configured through the CLI only at this point (esxcli) but that shouldn’t be a huge problem. As mentioned previously, what you end up doing is tagging a vmknic for “witness traffic” only. Pretty straight forward, but very useful:

esxcli vsan network ip set -i vmk<X> -T=witness

Another enhancement for stretched clusters is Preferred Site Override. It is a small enhancements, but in the past when the preferred site failed and returned for duty but would only be connected to the witness, it could happen that the witness would bind itself directly to the preferred site. This by itself would result in VMs becoming unavailable. This Preferred Site Override functionality would prevent this from happening. It will ensure that VMs (and all data) remains available in the secondary site. I guess one could also argue that this is not an enhancement, but much more a bug fix. And then there is the Efficient Resync for Stretched Clusters feature. This is getting a bit too much in to the weeds, but essentially it is a smarter way of bringing components up to the same level within a site after the network between locations has failed. As you can imagine 1 location is allowed to progress, which means that the other location needs to catch up when the network returns. With this enhancement we limit the bandwidth / resync traffic.

And as with every new release, the 6.7 release of course also has a whole new set of Health Checks. I think the Health Check has quickly become the favorite feature of all vSAN Admins, and for a good reason. It makes life much easier if you ask me. In the 6.7 release for instance we will validate consistency in terms of host settings and if an inconsistency is found report this. We also, when downloading the HCL details, will only download the differences between the current and previous version. (Where in the past we would simply pull the full json file.) There are many other small improvements around performance etc. Just give it a spin and you will see.

Something that my team has been pushing hard for (thanks Paudie) is the Enhanced Diagnostic Partition. As most of you know when you install / run ESXi there’s a diagnostic partition. This diagnostic partition unfortunately was a fixed size, with the current release when upgrading (or installing green field) ESXi will automatically resize the diagnostic partition. This is especially useful for large memory host configurations, actually useful for vSAN in general. No longer do you need to run a script to resize the partition, it will happen automatically for you!

Another optimization that was released in vSAN 6.7 is called “Efficient Decomissioning“. And this is all about being smarter in terms of consolidating replicas across hosts/fault domains to free up a host/fault domain to allow for maintenance mode to occur. This means that if a component is striped, for other reasons then policy, they may be consolidated. And the last optimization is what they refer to as Efficient and consistent storage policies. I am not sure I understand the name, as this is all about the swap object. Per vSAN 6.7 it will be thin provisioned by default (instead of 100% reserved), and also the swap object will now inherit the policy assigned to the VM. So if you have FTT=2 assigned to the VM, then you will have not two but three components for the swap object, still thin provisioned so it shouldn’t really change the consumed space in most cases.

Then there are the two last items on the list: 4K Native Device Support and FIPS 140-2 Level 1 validation. I think those speak for itself. 4K Native Device Support has been asked for by many customers, but we had to wait for vSphere to support it. vSphere supports it as of 6.7, so that means vSAN will also support it Day 0. The ​VMware VMkernel Cryptographic Module v1.0 has achieved FIPS 140-2, vSAN leverages the same module for vSAN Encryption. Nice collaboration by the teams, which is now showing the big benefit.

Anyway, there’s more work to do today, back to my desk and release the next article. Oh, and if you haven’t seen it yet, Virtual Blocks also has a blog and there’s a nice podcast on the topic of 6.7 as well.

  • « Go to Previous Page
  • Page 1
  • Interim pages omitted …
  • Page 14
  • Page 15
  • Page 16
  • Page 17
  • Page 18
  • Interim pages omitted …
  • Page 71
  • Go to Next Page »

Primary Sidebar

About the Author

Duncan Epping is a Chief Technologist and Distinguished Engineering Architect at Broadcom. Besides writing on Yellow-Bricks, Duncan is the co-author of the vSAN Deep Dive and the vSphere Clustering Deep Dive book series. Duncan is also the host of the Unexplored Territory Podcast.

Follow Us

  • X
  • Spotify
  • RSS Feed
  • LinkedIn

Recommended Book(s)

Also visit!

For the Dutch-speaking audience, make sure to visit RunNerd.nl to follow my running adventure, read shoe/gear/race reviews, and more!

Do you like Hardcore-Punk music? Follow my Spotify Playlist!

Do you like 80s music? I got you covered!

Copyright Yellow-Bricks.com © 2026 · Log in