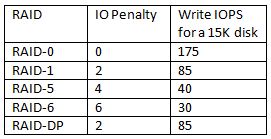
I just added a real life RAID penalty example to the IOps article. I know Sys Admins are lazy, so here’s the info I just added:
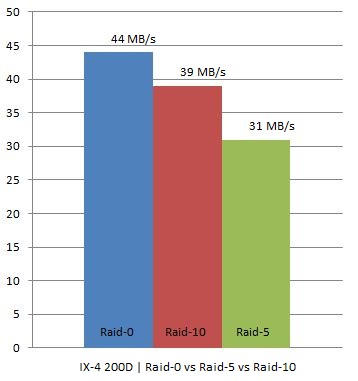
I have two IX4-200Ds at home which are capable of doing RAID-0, RAID-10 and RAID-5. As I was rebuilding my homelab I thought I would try to see what changing RAID levels would do on these homelab / s(m)b devices. Keep in mind this is by no means an extensive test. I used IOmeter with 100% Write(Sequential) and 100% Read(Sequential). Read was consistent at 111MB for every single RAID level. However for Write I/O this was clearly different, as expected. I did all tests 4 times to get an average and used a block size of 64KB as Gabes testing showed this was the optimal setting for the IX4.
In other words, we are seeing what we were expecting to see. As you can see RAID-0 had an average throughput of 44MB/s, RAID-10 still managed to reach 39MB/s but RAID-5 dropped to 31MB/s which is roughly 21% less than RAID-10.
I hope I can do the “same” tests on one of the arrays or preferably both (EMC NS20 or NetApp FAS2050) we have in our lab in Frimley!