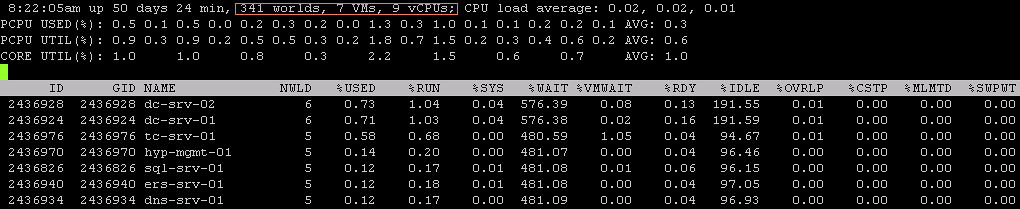
I got this question today around %WAIT and why it was so high for all these VMs. I grabbed a screenshot from our test environment. It shows %WAIT next to %VMWAIT.
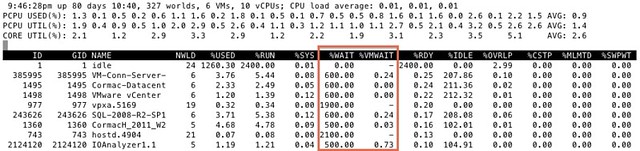
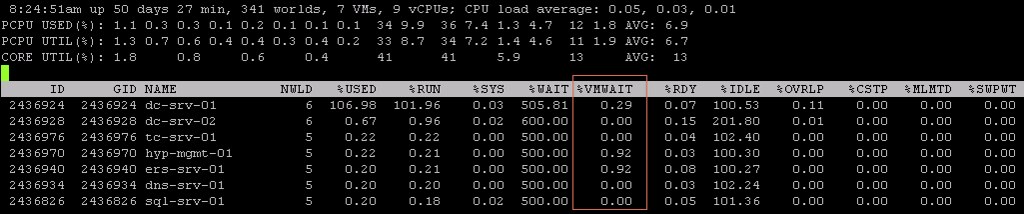
First of all, I suggest looking at %VMWAIT. This one is more relevant in my opinion than %WAIT. %VMWAIT is a derivative of %WAIT, however it does not include %IDLE time but does include %SWPWT and the time the VM is blocked for when a device is unavailable. That kind of reveals immediately why %WAIT seems extremely high, it includes %IDLE! Another thing to note is the %WAIT for a VM is multiple worlds collided in to a single metric. Let me show you what I mean:
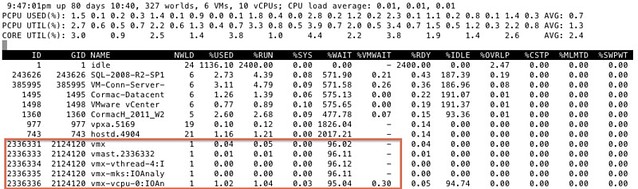
As you can see 5 worlds, which explains the %WAIT time to be around 500% constantly when the VM is not doing much. Hope that helps…
<edit> I just got pointed to this great KB article by one of my colleagues. It explains various CPU metrics in-depth. Key take away from that article for me is the following: %WAIT + %RDY + %CSTP + %RUN = 100%. Note that this is per world! Thanks Daniel for pointing this out!</edit>