I was just playing around with esxtop in vSphere 5.0 and spotted something that changed. I figured there must be more so I started digging. I didn’t dig too deep as there is a great VMworld session (VSP1999) on this topic by Krishna Raj Raja and I figured why re-invent the wheel. Anyway, here’s the things I noticed which will definitely come in handy at some point while troubleshooting performance issues:
- Each display type now shows the number of Worlds, VMs and vCPUs on the host on the first line. This will allow you to quickly identify why there for instance is a high %RDY.
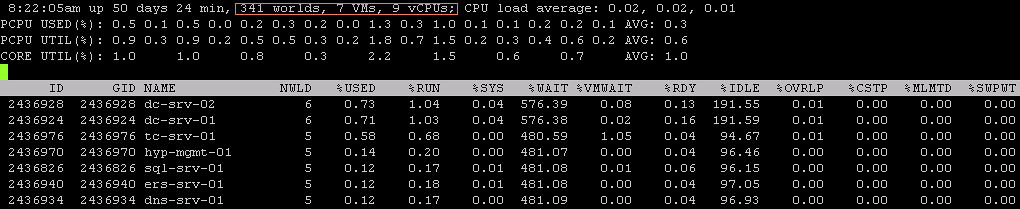
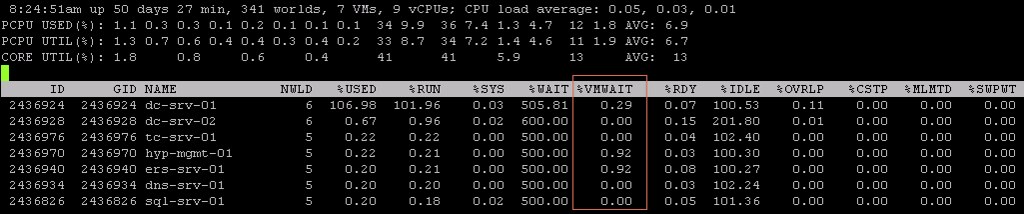
- %VMWAIT is a derivitive of %WAIT, however it does not include IDLE time and only %SWPWT and “blocked”. It could for instance also be blocked when the connectivity to the storage device has failed.
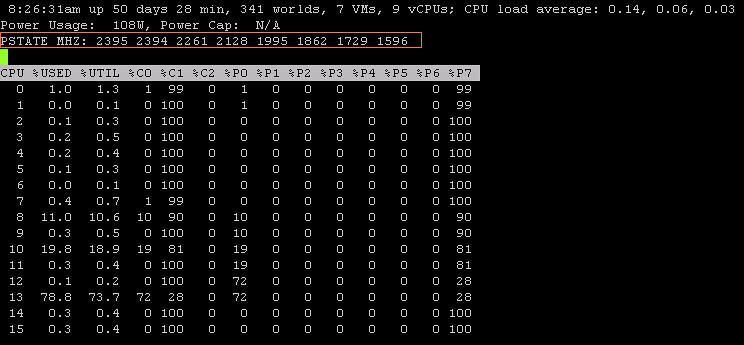
- In the Power display there’s a new line which is PSTATE MHZ. This shows you the different clock frequencies per state. For instance “2395” is the clock frequency of %P0 and “1596” is the clock frequency of %P7. Please note that “%USED” is based on the base (%P0) of your CPU. %UTIL is the utilization in it’s current state (%Px), so in this case that could be 40% of %P7 (1596) which is 638.
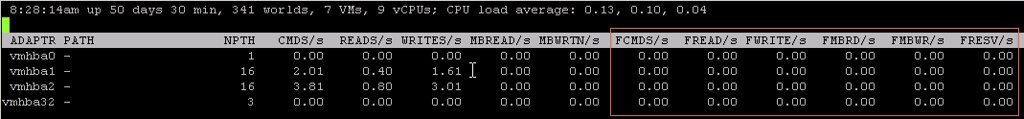
- In the “Device Display” there are new stats starting with “F”, for example FCMDs, these show the failed I/Os. Fairly quick way to see if there are any I/O errors.
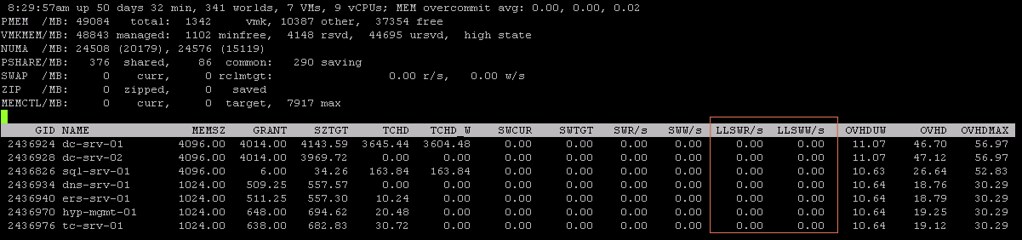
- These two new counters in the “Memory Display”, LLSWR/s / LLSWW/s, show the amount of memory being written to host cache or read from host cache. Useful when you have enabled this feature and want to know if it is actively being used. Of course there are also vCenter stats for this one.
I love esxtop, with 5.0 is has become even better and especially “%VMWAIT” and the PSTATE details will come in handy at some point in time!
Duncan,
I noticed the VAAI DELETE, DELETE_F, and MBDEL/s stats for tracking block deletions. Having a bit of a problem finding out if this is to track block zeroing or something else entirely! “Why” would I want to track block deletion? Dead space reclamation? Was about to ask Krishna, but saw your post…
Thanks!
Tom