I got this question today around %WAIT and why it was so high for all these VMs. I grabbed a screenshot from our test environment. It shows %WAIT next to %VMWAIT.
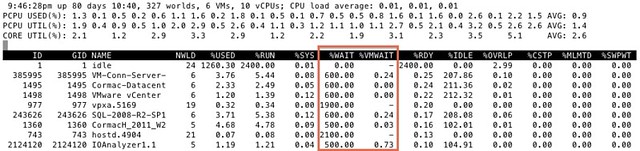
First of all, I suggest looking at %VMWAIT. This one is more relevant in my opinion than %WAIT. %VMWAIT is a derivative of %WAIT, however it does not include %IDLE time but does include %SWPWT and the time the VM is blocked for when a device is unavailable. That kind of reveals immediately why %WAIT seems extremely high, it includes %IDLE! Another thing to note is the %WAIT for a VM is multiple worlds collided in to a single metric. Let me show you what I mean:
As you can see 5 worlds, which explains the %WAIT time to be around 500% constantly when the VM is not doing much. Hope that helps…
<edit> I just got pointed to this great KB article by one of my colleagues. It explains various CPU metrics in-depth. Key take away from that article for me is the following: %WAIT + %RDY + %CSTP + %RUN = 100%. Note that this is per world! Thanks Daniel for pointing this out!</edit>
Nice article on a new metric shown with esxtop 5.
One metric i’m stuck on is %LAT_C, and how that differs to %RDY. The descriptions are very similar, yet i see quite a difference in the values displayed.
Are you able to explain it?
Cheers.
d_
Somebody asked the same question at:
http://communities.vmware.com/message/2077455#2077455
@D_: Lat_C is a cumulative of various metrics. I will try to dig up which ones exactly.
Whats the point of %WAIT then if VMware finaly wised up and is giving us a wait value that is way more meaningful?
I hate having to explain %WAIT when it includes a metric that is the opposite of what we actually care about.
Even Microsoft was smart enough to exclude “System Idle Process” when telling us what the CPU usage is!
Yes I’m aware that %WAIT includes metrics that aren’t just about processor usage but thats not the point.
Not sure what your point is either Fred. ESXTOP is not a monitoring tool. It is there for troubleshooting, and metrics are simply not removed to provide backwards compatibility to 3rd party scripts / solutions using them.
I didn’t mean to imply %wait should be removed, rather is there any reason to even bother looking at the metric anymore to prove/disprove performance issues.
Good question, I normally don’t bother any longer… as other metrics are a far better indication.
Hm, I don’t understand one thing: when I expand a world I have 4 parts:
vmware-vmx Wait 97 Idle 0
vmn0:my_machine Wait 69 Idle 68
vmware-vmx Wait 97 Idle 0
mks:my_machhine Wait 97 Idle 0
1. the ‘real’ wait time for my VM is 1% ?
2. why the wait time for other things (vmx and mks) is so big? There is no idle to substract and is it around 97%
Could you Duncan help me with that please?
Hello, i’m wondering too in my systems
What is threshold for %VMWAIT ?