• Skip to primary navigation
  • Skip to main content
  • Skip to primary sidebar

Yellow Bricks

by Duncan Epping

  • Home
  • Unexplored Territory Podcast
  • HA Deepdive
  • ESXTOP
  • Stickers/Shirts
  • Privacy Policy
  • About
  • Show Search
Hide Search

vSphere 6.5 what’s new – HA

Duncan Epping · Oct 19, 2016 ·

Here we go, one of my favourite features in vSphere… What’s new for HA in vSphere 6.5. To be honest, a lot! Many new features have been introduced, and although it took a while, I am honoured to say that many of these features are the results of discussions I had with the HA engineering team in the past. On top of that, your comments and feedback on some of my articles about HA futures have resulted in various changes to the design and implementation, my thanks for that! Before we get started, one thing I want to point out, in the Web Client under “Services” it now states “vSphere Availability” instead of HA, the reason for this is that because a new feature was stuck in to this section which is all about Availability but not implemented through HA.

  • Admission Control
  • Restart Priority enhancements
  • HA Orchestrated Restart
  • ProActive HA

Lets start with Admission Control first. This has been completely overhauled from a UI perspective, but essential still offers the same functionality but in an easy way and some extras. Let take a look at the UI first and then break it down.

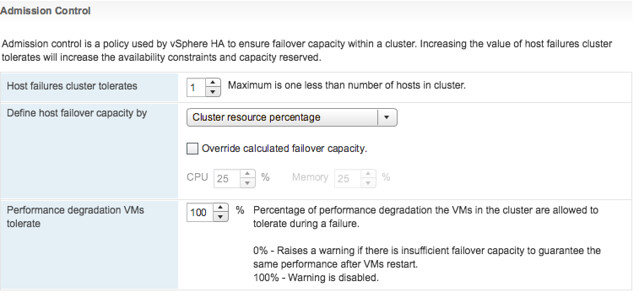
In the above screenshot we see “Cluster Resource Percentage” while above that we have specified the “Host failures cluster tolerates” as “1”. What does this mean? Well this means that in a 4 host cluster we want to be capable of losing 1 host worth of resources which equals 25%. The big benefit of this is that when you add a host to the cluster, the amount of resources set aside will then be automatically changed to 20%. So if you scale up, or down, the percentage automatically adjusts based on the selected number of failures you want to tolerate. Very very useful if you ask me as you won’t end up wasting resources any longer simply because you forgot to change the percentage when scaling the cluster. And the best, this doesn’t use “slots” but is the old “percentage based” solution still. (You can manually select the slot policy under “Define host failover capacity by” though if you prefer that.

Second part of enhancements around Admission Control is the “VM resource reduction event threshold” section. This is a new section and this is based on the fling that was out there for a while. I am very proud to see this being released as it is a feature I was closely involved with and actually had two patents awarded for recently. What does it do? It allows you to specify the performance degradation you are willing to incur if a failure happens. It is set to 100% by default, but I can imagine you want to change this to for instance 25% or 50%, depending on your SLA with the business. Setting it is very simple, you just change the percentage and you are done. So how does this work? Well first of all, you need DRS enabled as HA leverages DRS to get the cluster resource usage. But lets look at an example:

75GB of memory available in 3 node cluster
1 host failure to tolerate specifed
60GB of memory actively used by VMs
0% resource reduction tolerated

This results in the following:
75GB – 25GB (1 host worth of memory) = 50GB
We have 60GB of memory used, with 0% resource reduction to tolerate
60GB needed, 50GB available after failure >> Warning issued to Admin

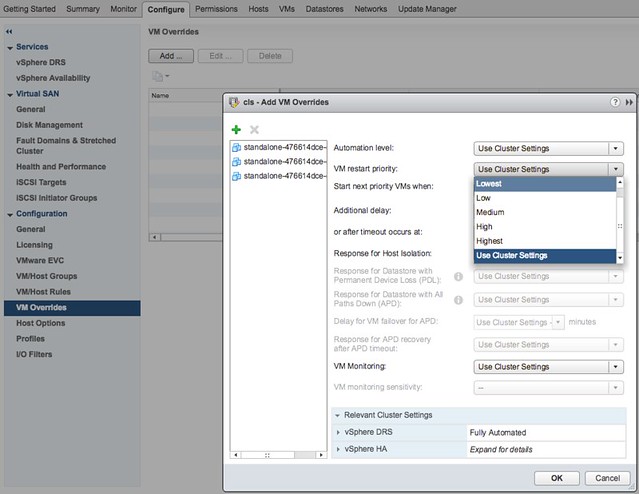
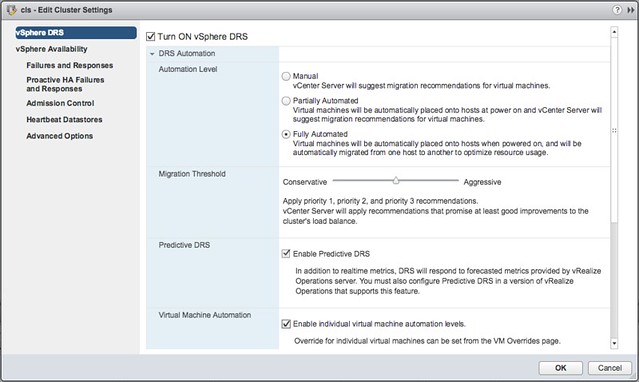
Very useful if you ask me, as finally you can guarantee that the performance for you workloads after a failure event is close or equal to the performance before a failure event! Next up, Restart Priority enhancements. We have had this option in the UI for the longest time. It allowed you to specify the startup priority for VMs and that is what HA used during scheduling, however the restarts would happen so fast that in reality no one really noticed the difference between high, medium or low priority. In fact, in many cases the small “low priority” VMs would be powered up long before the larger “high priority” database machines. With 6.5 we introduce some new functionality. Lets show you how this works:

Go to your vSphere HA cluster and click on the configure tab and then select VM Overrides, next click Add. You are presented with a screen where you can select VMs by clicking the green plus and then specify their relative startup priority. I selected 3 VMs and then pick “lowest”, the other options are “low, medium, high and highest”. Yes the names are a bit funny, but this is to ensure backwards compatibility with the previous priority options.

After you have specified the priority you can also specify if there needs to be an additional delay before the next batch can be started, or you can specify even what triggers the next priority “group”, this could for instance be the VMware Tools guest heartbeat as shown in the screenshot below. The other option is “resources allocated” which is purely the scheduling of the batch itself, the power-on event completion or the “app heartbeat” detection. That last one is most definitely the most complex as you would need to have App HA enabled and services defined etc. I expect that if people use this they will mostly set it to “Guest Heartbeats detected” as that is easy and pretty reliable.

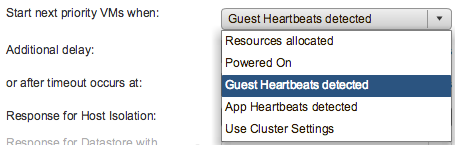
If for whatever reason by the way there is no guest heartbeat ever, or it simply takes a long time then there is also a timeout value that can be specified. By default this is 600 seconds, but this can be decreased or increased, depending on what you prefer. Now this functionality is primarily intended for large groups of VMs, so if you have a 1000 VMs you can select those 10/20 VMs that have the highest priority and let them power-on first. However, if you for instance have a 3-tier app and you need the database server to be powered on before the app server then you can also use VM/VM rules as of vSphere 6.5, this functionality is referred to as HA Orchestrated Restart.

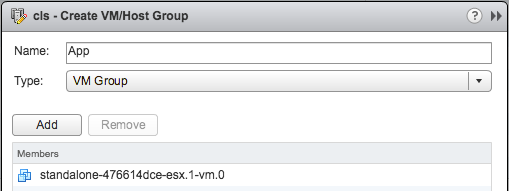
You can configure HA Orchestrated Restarts by simply creating “VM” Groups. In the example below I have created a VM group called App with the Application VM in there. I have also created a DB group with the Database VM in there.

This application has a dependency on the Database VM to be fully powered-on, so I specify this in a rule as shown in the below screenshot.

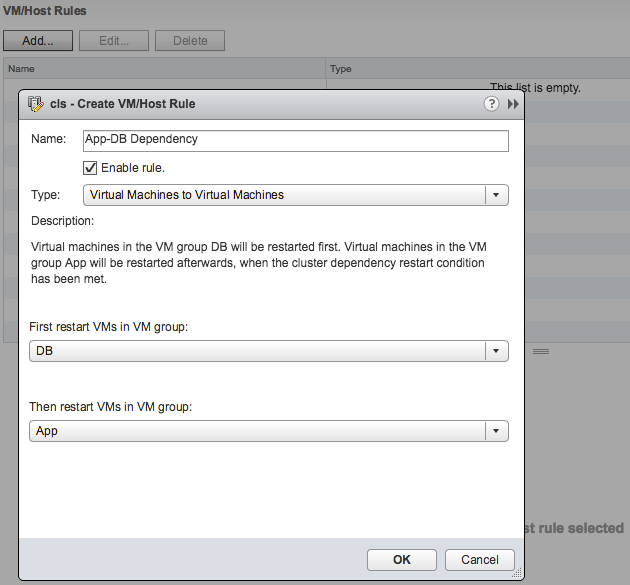
Now one thing to note here is that in terms of dependency, the next group of VMs in the rule will be powered on when the cluster wide set “VM Dependency Restart Condition” is met. If this is set to “Resources Allocated”, which is the default, then the VMs will be restarted literally a split second later. So you will need to think about how to set the “VM Dependency Restart Condition” as other wise the rule may be useless. Another thing is that these rules are “hard rules”, so if the DB VM in this example does not power on, then the App VM will also not be powered on. Yes, I know what you would like to see, and yes we are planning more enhancements in this space.

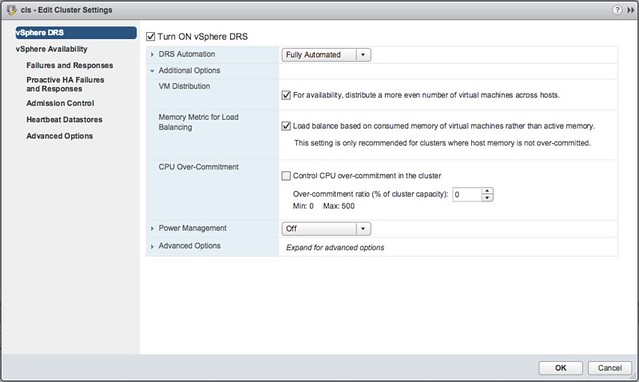
Last up “Pro-Active HA“… Now this is the odd one, it is not actually a vSphere HA feature, but rather a function of DRS. However, as it is stuck in the “Availability” section of the UI I figured I would stick it in this article as that is probably where most people will be looking. So what does it do? Well in short, it allows you to configure actions for events that may lead to VM downtime. What does that mean? Well you can imagine that when a power-supply goes down your host is in a so called “degraded state”, when this event occurs an evacuation of the host could be triggered, meaning all VMs will be migrated to any of the remaining healthy hosts in the cluster.

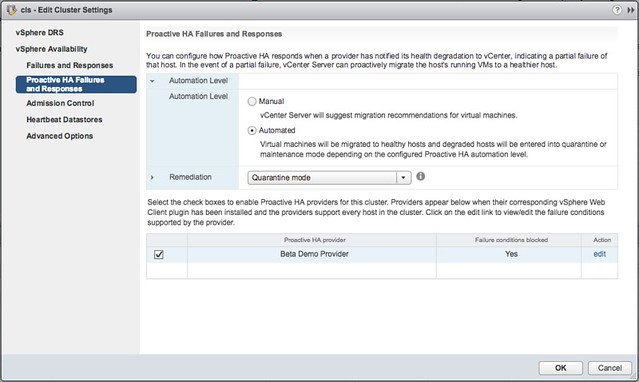
But how do we know the host is in a degraded state? Well that is where the Health Provider comes in to play. The health provider reads all the sensor data and analyze the results and then serve the state of the host up to vCenter Server. These states are “Healthy”, “Moderate Degration”, “Severe Degradation” and “Unknown”. (Green, Yellow, Red) When vCenter is informed DRS can now take action based on the state of the hosts in a cluster, but also when placing new VMs it can take the state of a host in to consideration. The actions DRS can take by the way is placing the host in Maintenance Mode or Quarantine Mode. So what is this quarantine mode and what is the difference between Quarantine Mode and Maintenance Mode?

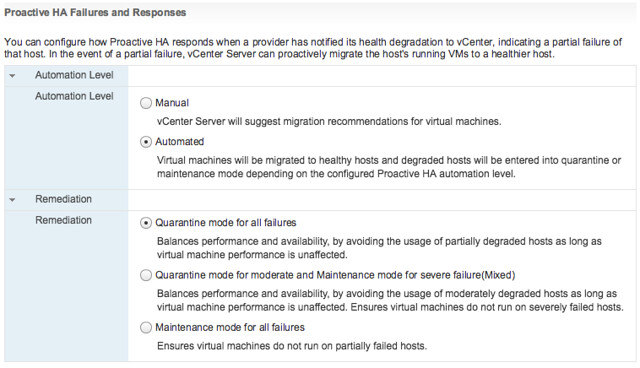
Maintenance Mode is very straight forward, all VMs will be migrated off the host. With Quarantine Mode this is not guaranteed. If for instance the cluster is overcommitted then it could be that some VMs are left on the quarantined host. Also, when you have VM-VM rules or VM/Host rules which would conflict when the VM is migrated then the VM is not migrated either. Note that quarantined hosts are not considered for placement of new VMs. It is up to you to decide how strict you want to be, and this can simply be configured in the UI. Personally I would recommend setting it to Automated with “Quarantine mode for moderate and Maintenance mode for sever failure(Mixed)”. This seems to be a good balance between up time and resource availability. Screenshot below shows where this can be configured.

Pro-Active HA can respond to different types of failures, at the start of this section I mentioned power supply, but it can also respond to memory, network, storage and even a fan failure. Which state this results in (severe or moderate) is up to the vendor, this logic is built in to the Health Provider itself. You can imagine that when you have 8 fans in a server that the failure of one or two fans results in “moderate”, whereas the failure of for instance 1 out of 2 NICs would result in “severe” as this leaves a “single point of failure”. Oh and when it comes to the Health Provider, this comes with the vendor Web Client plugins.

vSphere 6.5 what’s new – DRS

Duncan Epping · Oct 19, 2016 ·

Most of us have been using DRS for the longest time. To be honest, not much has changed over the past years, sure there were some tweaks and minor changes but nothing huge. In 6.5 however there is a big feature introduced, but lets just list them all for completeness sake:

  • Predictive DRS
  • Network-Aware DRS enhancements
  • DRS profiles

First of all Predictive DRS. This is a feature that the DRS team has been working on for a while. It is a feature that integrates DRS with VROps to provide placement and balancing decisions. Note that this feature will be in Tech Preview until vRealize Operations releases their version of vROPs which will be fully compatible with vSphere 6.5, hopefully sometime in the first half of next year. Brian Graf has some additional details around this feature here by the way.

Note that of course DRS will continue to use the data provided by vCenter Server, it will on top of that however also leverage VROps to predict what resource usage will look like, all of this based on historic data. You can imagine a VM currently using 4GB of memory (demand), however every day around the same time a SQL Job runs which makes the memory demand spike up to 8GB. This data is available through VROps now and as such when making placement/balancing recommendations this predicted resource spike can now be taken in to consideration. If for whatever reason however the prediction is that the resource consumption will be lower then DRS will ignore the prediction and simply take current resource usage in to account, just to be safe. (Which makes sense if you ask me.) Oh and before I forget, DRS will look ahead for 60 minutes (3600 seconds).

How do you configure this? Well that is fairly straight forward when you have VROps running, go to your DRS cluster and click edit settings and enable the “Predictive DRS” option. Easy right? (See screenshot below) You can also change that look ahead value by the way, I wouldn’t recommend it though but if you like you can add an advanced setting called ProactiveDrsLookaheadIntervalSecs.

One of the other features that people have asked about is the consideration of additional metrics during placement/load balancing. This is what Network-Aware DRS brings. Within Network IO Control (v3) it is possible to set a reservation for a VM in terms of network bandwidth and have DRS consider this. This was introduced in vSphere 6.0 and now with 6.5 has been improved. With 6.5 DRS also takes physical NIC utilization in to consideration, when a host has higher than 80% network utilization it will consider this host to be saturated and not consider placing new VMs.

And lastly, DRS Profiles. So what are these? In the past we’ve seen many new advanced settings introduced which allowed you to tweak the way DRS balanced your cluster. In 6.5 several additional options have been added to the UI to make it easier for you to tweak DRS balancing, if and when needed that is as I would expect that for the majority of DRS users this would not be the case. Lets look at each of the new options:

So there are 3 options here:

  • VM Distribution
  • Memory Metric for Load Balancing
  • CPU Over-Commitment

If you look at the description then I think they make a lot of sense. Especially the first two options are options I get asked about every once in a while. Some people prefer to have a more equally balanced cluster in terms of number of VMs per host, which can be done by enable “VM Distribution”. And for those who much rather load balance on “consumed” vs “active” memory you can also enable this. Now the “consumed” vs “active” is almost a religious debate, personally I don’t see too much value, especially not in a world where memory pages are zeroed when a VM boots and consumed is always high for all VMs, but nevertheless if you prefer you can balance on consumed instead. Last is the CPU Over-Commitment, this is one that could be useful when you want to limit the number of vCPUs per pCPU, apparently this is something that many VDI customers have asked for.

I hope that was useful, we are aiming to update the vSphere Clustering Deepdive at some point as well to include some of these details…

What is new for Virtual SAN 6.5?

Duncan Epping · Oct 18, 2016 ·

As most of you have seen by the explosion of tweets, Virtual SAN 6.5 was just announced. Some may wonder how 6.5 can be announced so fast after the Beta Announcement, well this is not the same release. This release has a couple of key new features, lets look at those:

  • Virtual SAN iSCSI Service
  • 2-Node Direct Connect
    • Witness Traffic Separation for ROBO
  • 512e drive support

Lets start with the biggest feature of this release, at least in my opinion, Virtual SAN iSCSI Service. This provides what you would think it provides: the ability to create iSCSI targets and LUNs and expose those to the outside world. These LUNs by the way are just VSAN objects, and these objects have a storage policy assigned to them. This means that you get iSCSI LUNs with the ability to change performance and/or availability on the fly. All of it through the interface you are familiar with, the Web Client. Let me show you how to enable it:

  • Enable the iSCSI Target Service
  • Create a target, and a LUN in the same interface if desired
  • Done

How easy is that? Note that there are some restrictions in terms of use cases. It is primarily targeting physical workloads and Oracle RAC. It is not intended for connecting to other vSphere clusters for instance. Also, you can have a max of 1024 LUNs per cluster and 128 targets per cluster at most. LUN capacity limit is 62TB.

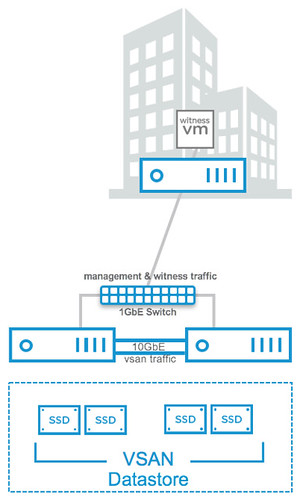
Next up on the list is 2-node direct connect. What does this mean? Well it basically means you can now cross-connect two VSAN hosts with a simple ethernet cable as shown in the diagram in the right. Big benefit of course is that you can equip your hosts with 10GbE NICs and get 10GbE performance for your VSAN traffic (and vMotion for instance) but don’t incur the cost of a 10GbE switch.

This can make a huge difference when it comes to total cost of ownership. In order to achieve this though you will also need to setup a separate VMkernel interface for Witness Traffic. And this is the next feature I wanted to mention briefly. For 2-node configurations it will be possible as of VSAN 6.5 to separate witness traffic by tagging a VMkernel interface as a designated witness interface. There’s a simple “esxcli” command for it, note that <X> needs to be replaced with the number of the VMkernel interface:

esxcli vsan network ip set -i vmk<X> -T=witness

Then there is the support for 512e drives, note that 4k native is not supported at this point. Not sure what more to say about it than that… It speaks for itself.

Oh and one more thing… All-Flash has been moved down from a licensing perspective to “Standard“. This means anyone can now deploy all-flash configuration at no additional licensing cost. Considering how fast the world is moving to all-flash I think this only makes sense. Note though that data services like dedupe/compression/raid-5/raid-6 are still part of VSAN Advanced. Nevertheless, I am very happy about this positive licensing change!

vSphere 6.5 what’s new – VMFS 6 / Core Storage

Duncan Epping · Oct 18, 2016 ·

I haven’t spend a lot of time looking at VMFS lately. I was looking in to what was new for vSphere 6.5 and then noticed a VMFS section. Good to see there is still being worked on new features and functionality for the core vSphere file system. So what is new with VMFS 6:

  • Support for 4K Native Drives in 512e mode
  • SE Sparse Default
  • Automatic Space Reclamation
  • Support for 512 devices and 2000 paths (versus 256 and 1024 in the previous versions)
  • CBRC aka View Storage Accelerator

Lets look at them one by one, I think support for 4K native drives in 512e mode speaks for itself. Sizes of spindles keep growing and these new “advanced format” drives come with a 4K byte sector instead of the usual 512 byte sector, which is primarily for better handling of media errors. As of vSphere 6.5 this is now fully supported but note that for now it is only supported when running in 512e mode! The same applies to Virtual SAN in the 6.5 release, only supported in 512e mode. This basically means that 512 byte sectors is being emulated on a 4k drive. Hopefully we will have more on full support for 4Kn for vSphere/VSAN soon.

From an SE Sparse perspective, right now SE Sparse is used primarily View and for LUNs larger than 2TB. When on VMFS 6 the default will be SE Sparse. Not much more to it than that. If you want to know more about SE Sparse, read this great post by Cormac.

Automatic Space Reclamation is something that I know many of my customers have been waiting for. Note that this is based on VAAI Unmap which has been around for a while and allows you to unmap previously used blocks. In other words, storage capacity is reclaimed and released to the array so that when needed other volumes can use these blocks. In the past you needed to run a command to reclaim  the blocks, now this has been integrated in the UI and can simply be turned on or off. Oh, you can find this in the UI when you go to your datastore object and then click configure, you can set it to “none” which means you disable it, or you set it to low in the UI as shown in the screenshot below.

If you prefer “esxcli” then you can do the following to get the info of a particular datastore (sharedVmfs-0 in my case) :

esxcli storage vmfs reclaim config get -l sharedVmfs-0
   Reclaim Granularity: 1048576 Bytes
   Reclaim Priority: low

Or set the datastore to a particular level, note that using esxcli you can also set the priority to medium and high if desired:

esxcli storage vmfs reclaim config set -l sharedVmfs-0 -p high

Next up, support for 512 Devices and 2000 Paths. In previous versions the limit was 256 devices and 1024 paths and some customers were hitting this limit in their cluster. Especially when RDMs are used or people have a limited number of VMs per datastore, or maybe 8 paths to each device are used it becomes easy to hit those limits. Hopefully with 6.5 that will not happen anytime soon. On the other hand, personally I would hope more and more people are considering moving towards either VSAN or Virtual Volumes.

This is one I accidentally ran in to and not really directly related to VMFS but I figured I would add it here anyway otherwise I would forget about it. In the past CBRC aka View Storage Accelerator was limited to 2GB of memory cache per host. I noticed in the advanced settings that it now is set to 32GB, which is a big difference compared to the 2GB in previous releases. I haven’t done any testing, but I assume our EUC team has and hopefully we will see some good performance data on this big increase soon.

And that was it… some great enhancements in the core storage space if you ask me. And I am sure there was even more, and if I find out more details I will share those with you as well.

Cool Tool: SDDC Discovery aka bringing back “Maps”

Duncan Epping · Oct 16, 2016 ·

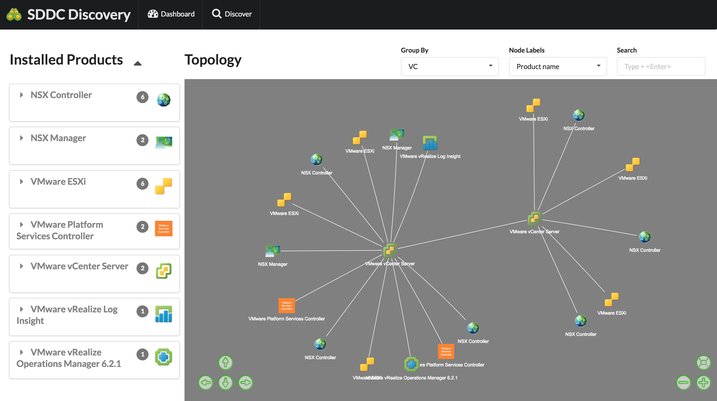
You still recall the days where you had the awesome map view in the vCenter Client? That unfortunately was removed from the Web Client. A shame as it was very useful for troubleshooting and seeing relationships between components of their stack. Guess what?! We just released a fling where we show you a map of your VMware products and how they are connected. I think it is brilliant to have that fling made available, and it would even be better if we can get this in to our products at some point. If you want to test it out, go to the SDDC Discovery Tool fling page and download it, don’t forget to leave feedback!

Awesome tool if you ask me, very useful, and if I can do a feature request, I would love to see some sort of grouping for the hosts which belong to the same cluster. Maybe stack the hosts in a cluster object and allow to drill down to see them all. Just a thought.

  • « Go to Previous Page
  • Page 1
  • Interim pages omitted …
  • Page 91
  • Page 92
  • Page 93
  • Page 94
  • Page 95
  • Interim pages omitted …
  • Page 492
  • Go to Next Page »

Primary Sidebar

About the Author

Duncan Epping is a Chief Technologist and Distinguished Engineering Architect at Broadcom. Besides writing on Yellow-Bricks, Duncan is the co-author of the vSAN Deep Dive and the vSphere Clustering Deep Dive book series. Duncan is also the host of the Unexplored Territory Podcast.

Follow Us

  • X
  • Spotify
  • RSS Feed
  • LinkedIn

Recommended Book(s)

Advertisements


Copyright Yellow-Bricks.com © 2025 · Log in