• Skip to primary navigation
  • Skip to main content
  • Skip to primary sidebar

Yellow Bricks

by Duncan Epping

  • Home
  • Unexplored Territory Podcast
  • HA Deepdive
  • ESXTOP
  • Stickers/Shirts
  • Privacy Policy
  • About
  • Show Search
Hide Search

vstorage

Storage IO Control Best Practices

Duncan Epping · Oct 19, 2010 ·

After attending Irfan Ahmad’s session on Storage IO Control at VMworld I had the pleasure to sit down with Irfan and discuss SIOC. Irfan was so kind to review my SIOC articles(1, 2) and we discussed a couple of other things as well. The discussion and the Storage IO Control session contained some real gems and before my brain resets itself I wanted to have these documented.

Storage IO Control Best Practices:

  • Enable Storage IO Control on all datastores
  • Avoid external access for SIOC enabled datastores
    • To avoid any interference SIOC will stop throttling, more info here.
  • When multiple datastores share the same set of spindles ensure all have SIOC enabled with comparable settings and all have sioc enabled.
  • Change latency threshold based on used storage media type:
    • For FC storage the recommended latency threshold is  20 – 30 MS
    • For SAS storage the recommended latency threshold is  20 – 30 MS
    • For SATA storage the recommended latency threshold is 30 – 50 MS
    • For SSD storage the recommended latency threshold is 15 – 20 MS
  • Define a limit per VM for IOPS to avoid a single VM flooding the array
    • For instance limit the amount of IOPS per VM to a 1000

SIOC, tying up some loose ends

Duncan Epping · Oct 8, 2010 ·

After my initial post about Storage IO Control I received a whole bunch of questions. Instead of replying via the commenting system I decided to add them to a blog post as it would be useful for everyone to read this. Now I figured this stuff out be reading the PARDA whitepaper 6 times and by going through the log files and CLI of my ESXi host, this is not cast in stone. If anyone has any additional question don’t hesitate to ask them and I’ll be happy to add them and try to answer them!

Here are the questions with the answers underneath in italic:

  1. Q: Why is SIOC not enabled by default?
    A: As datastores can be shared between clusters, clusters could be differently licensed and as such SIOC is not enabled by default.
  2. Q: If vCenter is only needed when enabling the feature, who will keep track of latencies when a datastore is shared between multiple hosts?
    A: Latency values are actually stored on the Datastore itself. From the PARDA academic paper, I figured two methods could be used for this either through network communication or as stated by using the Datastore. Notice the file “iormstat.sf” in green in the screenshot below, I guess that answers the question… the datastore itself is used to communicate the latency of a datastore. I also confirmed with Irfan that my assessment was true.
  3. Q: Where does datastore-wide disk scheduler run from?
    A: The datastore-wide disk scheduler is essentially SIOC or also known as the “PARDA Control Algorithm” and runs on each host sharing that datastore. PARDA consists of two key components which are “latency estimation” and “window size computation”. Latency estimation is used to detect if SIOC needs to throttle queues to ensure each VM gets its fair share. Window size computation is used to calculate what this queue depth should be for your host.
  4. Q: Is PARDA also responsible for throttling the VM?
    A: No, PARDA itself or better said the two major processes that form PARDA (latency estimation and window size computation) don’t control “host local” fairness, the Local scheduler (SFQ) is responsible for that.
  5. Q: Can we in any way control the I/O contention in vCD VM environment (say one VM running high I/O impacting another VM running on same host/datastore)
    A: I would highly recommend to enable this in vCloud Environments to prevent storage based DoS attacks (or just noisy neighbors) and to ensure IO fairness can be preserved. This is one of the reasons VMware developed this mechanism.
  6. Q: I can’t enable SIOC with an Enterprise licence – “License not available to perform the operation”. Is it Enterprise Plus only?
    A: SIOC requires Enterprise Plus
  7. Q: Can I verify what the Latency is?
    A: Yes you can, go to the Host – Performance Tab and select “Datastore”, “Real Time”, select the datastore and select “Storage I/O Control normalized latency”. Please note that the unit for measurement is microseconds!
  8. Q: This doesn’t appear to work in NFS?
    A: SIOC can only be enabled on VMFS volumes currently.

If you happen to be at VMworld next week, make sure to attend this session: TA8233 Prioritizing Storage Resource Allocation in ESX Based Virtual Environments Using Storage I/O Control!

Storage I/O Fairness

Duncan Epping · Sep 29, 2010 ·

I was preparing a post on Storage I/O Control (SIOC) when I noticed this article by Alex Bakman. Alex managed to capture the essence of SIOC in just two sentences.

Without setting the shares you can simply enable Storage I/O controls on each datastore. This will prevent any one VM from monopolizing the datatore by leveling out all requests for I/O that the datastore receives.

This is exactly the reason why I would recommend anyone who has a large environment, and even more specifically in cloud environments, to enable SIOC. Especially in very large environments where compute, storage and network resources are designed to accommodate the highest common factor it is important to ensure that all entities can claim their fair share of resource and in this case SIOC will do just that.

Now the question is how does this actually work? I already wrote a short article on it a while back but I guess it can’t hurt to reiterate thing and to expand a bit.

First a bunch of facts I wanted to make sure were documented:

  • SIOC is disabled by default
  • SIOC needs to be enabled on a per Datastore level
  • SIOC only engages when a specific level of latency has been reached
  • SIOC has a default latency threshold of 30MS
  • SIOC uses an average latency across hosts
  • SIOC uses disk shares to assign I/O queue slots
  • SIOC does not use vCenter, except for enabling the feature

When SIOC is enabled disk shares are used to give each VM its fair share of resources in times of contention. Contention in this case is measured in latency. As stated above when latency is equal or higher than 30MS, and the statistics around this are computed every 4 seconds, the “datastore-wide disk scheduler” will determine which action to take to reduce the overall / average latency and increase fairness. I guess the best way to explain what happens is by using an example.

As stated earlier, I want to keep this post fairly simple and I am using the example of an environment where every VM will have the same amount of shared. I have also limited the amount of VMs and hosts in the diagrams. Those of you who attended VMworld session TA8233 (Ajay and Chethan) will recognize these diagrams, I recreated and slightly modified them.

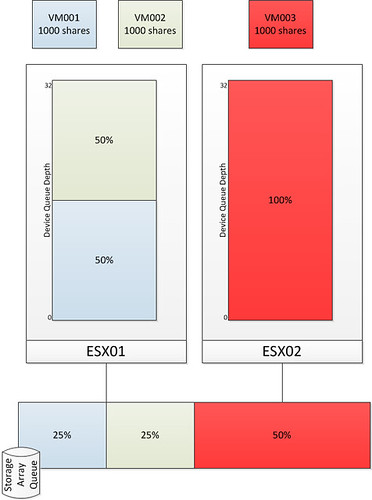
The first diagram shows three virtual machines. VM001 and VM002 are hosted on ESX01 and VM003 is hosted on ESX02. Each VM has disk shares set to a value of 1000. As Storage I/O Control is disabled there is no mechanism to regulate the I/O on a datastore level. As shown in the bottom by the Storage Array Queue in this case VM003 ends up getting more resources than VM001 and VM002 while all of them from a shares perspective were entitled to the exact same amount of resources. Please note that both Device Queue Depth’s are 32, which is the key to Storage I/O Control but I will explain that after the next diagram.

As stated without SIOC there is nothing that regulates the I/O on a datastore level. The next diagram shows the same scenario but with SIOC enabled.

After SIOC has been enabled it will start monitoring the datastore. If the specified latency threshold has been reached (Default: Average I/O Latency of 30MS) for the datastore SIOC will be triggered to take action and to resolve this possible imbalance. SIOC will then limit the amount of I/Os a host can issue. It does this by throttling the host device queue which is shown in the diagram and labeled as “Device Queue Depth”. As can be seen the queue depth of ESX02 is decreased to 16. Note that SIOC will not go below a device queue depth of 4.

Before it will limit the host it will of course need to know what to limit it to. The “datastore-wide disk scheduler” will sum up the disk shares for each of the VMDKs. In the case of ESX01 that is 2000 and in the case of ESX02 it is 1000. Next the  “datastore-wide disk scheduler” will calculate the I/O slot entitlement based on the the host level shares and it will throttle the queue. Now I can hear you think what about the VM will it be throttled at all? Well the VM is controlled by the Host Local Scheduler (also sometimes referred to as SFQ), and resources on a per VM level will be divided by the the Host Local Scheduler based on the VM level shares.

I guess to conclude all there is left to say is: Enable SIOC and benefit from its fairness mechanism…. You can’t afford a single VM flooding your array. SIOC is the foundation of your (virtual) storage architecture, use it!

ref:
PARDA whitepaper
storage i/o control whitepaper
vmworld storage drs session
vmworld storage i/o control session

What’s the point of setting “–IOPS=1” ?

Duncan Epping · Mar 30, 2010 ·

To be honest and completely frank I really don’t have a clue why people recommend setting “–IOPS=1” by default. I have been reading all these so called best practices around changing the default behaviour of “1000” to “1” but none of these contain any justification. Just to give you an example take a look at the following guide: Configuration best practices for HP StorageWorks Enterprise Virtual Array (EVA) family and VMware vSphere 4. The HP document states the following:

Secondly, for optimal default system performance with EVA, it is recommended to configure the round robin load balancing selection to IOPS with a value of 1.

Now please don’t get me wrong, I am not picking on HP here as there are more vendors recommending this. I am however really curious how they measured “optimal performance” for the HP EVA. I have the following questions:

  • What was the workload exposed to the EVA?
  • How many LUNs/VMFS volumes were running this workload?
  • How many VMs per volume?
  • Was VMware’s thin provisioning used?
  • If so, what was the effect on the ESX host and the array? (was there an overhead?)

So far none of of the vendors have published this info and I very much doubt, yes call me sceptical, that these tests have been conducted with a real life workload. Maybe I just don’t get it but  when consolidating workloads a threshold of a 1000 IOPS isn’t that high is it? Why switch after every single IO? I can imagine that for a single VMFS volume this will boost the performance as all paths will be equally hit and load distribution on the array will be optimal. But for a real life situation where you would have multiple VMFS volumes this effect decreases.  Are you following me? Hmmm, let me give you an example:

Test Scenario 1:

1 ESX 4.0 Host
1 VMFS volume
1 VM with IOMeter
HP EVA and IOPS set to 1 with Round Robin based on the ALUA SATP

Following HP’s best practices the Host will have 4 paths to the VMFS volume. However as the HP EVA is an Asymmetric Active Active array(ALUA) only two paths will be shown as “optimized”. (For more info on ALUA read my article here and Frank’s excellent article here.) Clearly when IOPS is set to 1 and there’s a single VM pushing IOs to the EVA on a single VMFS volume the “stress” produced by this VM would be equally divided on all paths without causing any spiky behaviour. In contrary to what a change of paths every “1000 IOs” might do. Although a 1000 is not a gigantic number it will cause spikes in your graphs.

Now lets consider a different scenario. Let’s take a more realistic one:

Test Scenario 2:

8 ESX 4.0 Hosts
10 VMFS volumes
16 VMs per volume with IOMeter
HP EVA and IOPS set to 1 with Round Robin based on the ALUA SATP

Again each VMFS volume will have 4 paths but only two of those will be “optimized” and thus be used. We will have 160 VMs in total on this 8 Host cluster and 10 VMFS volumes which means 16 VMs per VMFS volume. (Again following all best practices.) Now remember we will only have two optimized paths per VMFS volume and we have 16 VMs driving traffic to a volume, but not only 16 VMs this is also coming from 8 different hosts to these Storage Processors. Potentially each host is sending traffic down every single path to every single controller…

Let’s assume the following:

  • Every VM produces 8 IOps on average
  • Every host runs 20 VMs of which 2 will be located on the same VMFS volume

This means that every ESX host changes the path to a specific VMFS volume every 62 seconds(1000/(2×8)), with 10 volumes that’s a change every 6 seconds on average per host. With 8 hosts in a cluster and just two Storage Processors… You see where I am going? Now I would be very surprised if we would see a real performance improvement when IOPS is set to 1 instead of the default 1000. Especially when you have multiple Hosts running multiple VMs hosted on multiple VMFS volumes. If you feel I am wrong here or work for a Storage Vendor and have access to the scenarios used please don’t hesitate to join the discussion.

<update> Let me point out though that every situation is different, if you have had discussions with your storage vendor based on your specific requirements and configuration and this recommendation was given… Do not ignore it, ask why and if it indeed fits –> implement! Your storage vendor has tested various configurations and knows when to implement what, this is just a reminder that implementing “best practices” blind is not always the best option!</update>

Definition of the advanced NFS options

Duncan Epping · Feb 13, 2010 ·

An often asked question when implementing NFS based storage is what do these advanced settings represent you are recommending me to change?

VMware published a great KB article which describes these. For instance:

NFS.HeartbeatMaxFailures
The number of consecutive heartbeat requests that must fail before the server is marked as unavailable.

The KB article does not only explain the separate NFS settings but also how you can calculate how long it can take before ESX marks a NFS share as unavailable. Good stuff, definitely highly recommended!

  • « Go to Previous Page
  • Page 1
  • Interim pages omitted …
  • Page 4
  • Page 5
  • Page 6
  • Page 7
  • Page 8
  • Interim pages omitted …
  • Page 11
  • Go to Next Page »

Primary Sidebar

About the Author

Duncan Epping is a Chief Technologist and Distinguished Engineering Architect at Broadcom. Besides writing on Yellow-Bricks, Duncan is the co-author of the vSAN Deep Dive and the vSphere Clustering Deep Dive book series. Duncan is also the host of the Unexplored Territory Podcast.

Follow Us

  • X
  • Spotify
  • RSS Feed
  • LinkedIn

Recommended Book(s)

Advertisements


Copyright Yellow-Bricks.com © 2025 · Log in