• Skip to primary navigation
  • Skip to main content
  • Skip to primary sidebar

Yellow Bricks

by Duncan Epping

  • Home
  • Unexplored Territory Podcast
  • HA Deepdive
  • ESXTOP
  • Stickers/Shirts
  • Privacy Policy
  • About
  • Show Search
Hide Search

VMware

Introducing vSAN File Services as part of vSAN 7.0

Duncan Epping · Mar 17, 2020 ·

There was a great article by Cormac talking about vSAN File Services published last week. I had some articles planned, but hadn’t started yet, so when I saw the article I figured I would do something different. No point in rehashing what Cormac has already shared right. I figured I would shoot another demo, and do a brief write-up so people know what vSAN File Services is all about. In vSAN/vSphere 7.0 there’s now a new feature, and this is vSAN File Service. vSAN File Services can simply be enabled on a cluster level and provides you NFS 3 and 4.1 capabilities. The great thing about the solution is that you can create file shares and associate policies with the file shares. In other words, you can have a file share with RAID-1, RAID-5, or maybe even striping or stretched across locations when that is supported.

When you enable File Service, vSAN will deploy a number of “agent VMs” and these VMs/appliances are fully managed by vSAN. These agent VMs run Photon OS and have the file service capabilities enabled through docker/container technology. After these File Service Agent VMs have been deployed, the docker container instances have been instantiated and configured, vSAN File Service will be up and running and available for use. Next, you could simply create a file share and start consuming it. But before I reveal everything, let’s just head over to the demo below. I hope you enjoy it!

vSphere 7 and DRS Scalable Shares, how are they calculated?

Duncan Epping · Mar 16, 2020 ·

I wrote a post and recorded a short demo that explained this cool new feature called Scalable Shares, part of vSphere 7 / DRS, last week. I didn’t want to go too deep in the post, but now that I am getting more questions about how this actually works, I figured I would provide some examples to explain it. As mentioned in my previous post, Scalable Shares solves a problem many have been facing over the last decade or so, which is that DRS does not take the number of VMs in the pool into account when it comes to allocating resources. So as an example:

Just imagine you have a resource pool called “Test”, it is a resource pool with “normal” shares and has 4 VMs. Let’s say this resource pool has 4000 shares.

Now compare that resource pool to the “Production” pool, which has shares set to “high” but has 24 VMs. Let’s say this resource pool has 8000 shares.

This is a very extreme example, but it shows you immediately what the problem is. On a per VM basis, the VMs in the production resource pool, would receive far less resources when there’s contention as DRS would simply divvy up the resources based on the assignment of the shares of the resource pool. Test would receive 1/3 of the resource (4000 of 12000 total shares), and production would receive 2/3 of the resources (8000 of 12000 total shares). If you would divide that by the number of VMs in each pool, it is obvious that the VMs in Test are in a better situation than the VMs in Production.

So how would this work if you Scalable Shares enabled? Well, let’s list some facts first:

  • A resource pool looks like a VM with 4 vCPUs and 16GB of memory to DRS
  • Scalable Shares looks at the total amount of shares in the Resource Pool (all vCPUs!)
  • For a resource pool high is 8000 shares, normal is 4000 shares and low is 2000 shares
    • Note, that this is based on 4 vCPUs, so the real values are 2000, 1000, 500.

The calculation would be as following:

Resource Pool Shares = (4 vCPU * Shares of Pool )* (Total number of shares of all vCPUs in resource pool)

So as an example, in the case I have Test with normal shares and 4 VMs, and Production with high shares and 24 VMs, and all VMs have a single vCPU with normal priority the calculation for those two resource pools would be:

Test = (4 * 1000) * (4 * 1000) = 16,000,000 shares

Production = (4 * 2000) * (24 * 1000) = 192,000,000 shares

In other words, Production has 12 times more the number of shares as Test has when Scalable Shares is enabled. I hope that clears things up!

NVIDIA rendering issues? Look at the stats!

Duncan Epping · Feb 14, 2020 ·

I’ve been down in the lab for the last week doing performance testing with virtual reality workloads and streaming these over wifi to an Oculus Quest headset. In order to render the graphics remotely, we leveraged NVIDIA GPU technology (RTX 8000 in my case here in the lab). We have been getting very impressive results, but of course at some point hit a bottleneck. We tried to figure out which part of the stack was causing the problem and started looking at the various NVIDIA stats through nvidia-smi. We figured the bottleneck would be GPU, so we looked at things like GPU utilization, FPS etc. Funny enough this wasn’t really showing a problem.

We then started looking at different angles, and there are two useful commands I would like to share. I am sure the GPU experts will be aware of these, but for those who don’t consider themselves an expert (like myself) it is good to know where to find the right stats. While whiteboarding the solution and the different part of the stacks we realized that GPU utilization wasn’t the problem, neither was the frame buffer size. But somehow we did see FPS (frames per second) drop and we did see encoder latency go up.

First I wanted to understand how many encoding sessions there were actively running. This is very easy to find out by using the following command. The screenshot below shows the output of it.

nvidia-smi encodersessions

As you can see, this shows 3 encoding sessions. One H.264 session and two H.265 sessions. Now note that we have 1 headset connected at this point, but it leads to three sessions. Why? Well, we need a VM to run the application, and the headset has two displays. Which results in three sessions. We can, however, disable the Horizon session using the encoder, that would save some resources, I tested that but the savings were minimal.

I can, of course, also look a bit closer at the encoder utilization. I used the following command for that. Note that I filter for the device I want to inspect which is the “-i <identifier>” part of the below command.

nvidia-smi dmon -i 00000000:3B:00.0

The above command provides the following output, the “enc” column is what was important to me, as that shows the utilization of the encoder. Which with the above 3 sessions was hitting 40% utilization roughly as shown below.

How did I solve the problem of the encoder bottleneck in the end? Well I didn’t, the only way around that is by having a good understanding of your workload and proper capacity planning. Do I need an NVIDIA RTX 6000 or 8000? Or is there a different card with more encoding power like the V100 that makes more sense? Figuring out the cost, performance and the trade-off here is key.

Two more weeks until the end of my Take 3 experience, and what a ride it has been. If you work for VMware and have been with the company for 5 years… Consider doing a Take 3, it is just awesome!

vGPUs and vMotion, why the long stun times?

Duncan Epping · Feb 7, 2020 ·

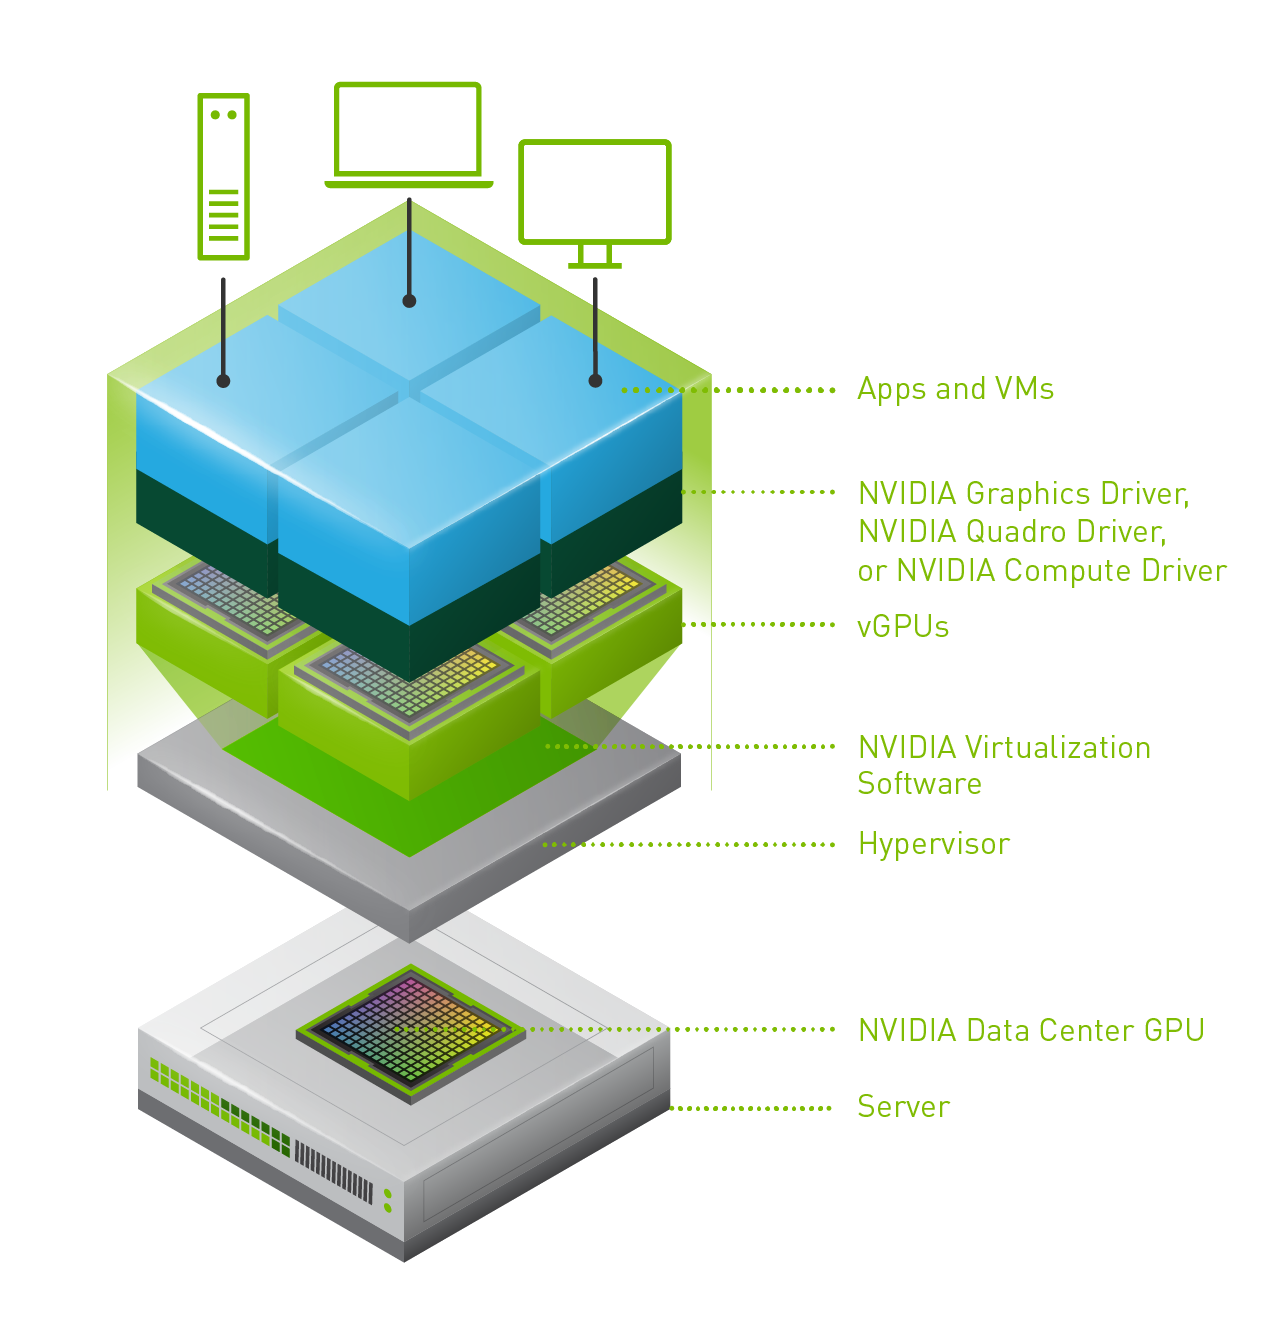
Last week one of our engineers shared something which I found very interesting. I have been playing with Virtual Reality technology and NVIDIA vGPUs for 2 months now. One thing I noticed is that we (VMware) introduced support for vMotion in vSphere 6.7 and support for vMotion of multi vGPU VMs in vSphere 6.7 U3. In order to enable this, you need to set an advanced setting first. William Lam described this in his blog how to set this via Powershell or the UI. Now when you read the documentation there’s one thing that stands out, and that is the relatively high stun times for vGPU enabled VMs. Just as an example, here are a few potential stun times with various sized vGPU frame buffers:

  • 2GB – 16.5 seconds
  • 8GB – 61.3 seconds
  • 16GB – 100+ seconds (time out!)

This is all documented here for the various frame buffer sizes. Now there are a couple of things to know about this. First of all, the time mentioned was tested with 10GbE and the NVIDIA P40. This could be different for an RTX6000 or RTX8000 for instance. Secondly, they used a 10GbE NIC. If you use multi-NIC vMotion or for instance a 25GbE NIC than results may be different (times should be lower). But more importantly, the times mentioned assume the full frame buffer memory is consumed. If you have a 16GB frame buffer and only 2GB is consumed then, of course, the stun time would be lower than the above mentioned 100+ seconds.

Now, this doesn’t answer the question yet, why? Why on earth are these stun times this long? The vMotion process is described in this blog post by Niels in-depth, so I am not going to repeat it. It is also described in our Clustering Deep Dive book which you can download here for free. The key reason why with vMotion the “down time” (stun times) can be kept low is that vMotion uses a pre-copy process and tracks which memory pages are changed. In other words, when vMotion is initiated we copy memory pages to the destination host, and if a page has changed during that copy process we mark it as changed and copy it again. vMotion does this until the amount of memory that needs to be copied is extremely low and this would result in a seamless migration. Now here is the problem, it does this for VM memory. This isn’t possible for vGPUs unfortunately today.

Okay, so what does that mean? Well if you have a 16GB frame buffer and it is 100% consumed, the vMotion process will need to copy 16GB of frame buffer memory from the source to the destination host when the VM is stunned. Why when the VM is stunned? Well simply because that is the point in time where the frame buffer memory will not change! Hence the reason this could take a significant number of seconds unfortunately today. Definitely something to consider when planning on using vMotion on (multi) vGPU enabled VMs!

Disabling the frame rate limiter for your vGPU

Duncan Epping · Feb 4, 2020 ·

I have been testing with Virtual Reality apps within a VM for the past few days and I am leveraging NVIDIA vGPU technology on vSphere 6.7 U3. I was running into some undesired behavior and was pointed to the fact that this could be due to the frame rate being limited by default (Thank Ben!). I first checked the head-mounted display to see at what kind of frame rate it was running, by leveraging “adbLink” (for Mac) and the logcat command I could see the current frame rate hovering between 55-60. For virtual reality apps that leads to problems when moving your head from left to right as you will see black screens. For the Quest, for those wanting to play around with it as well, I used the following command to list the current frame rate for the NVIDIA CloudXR application (note that this is specific to this app) and “-s” filters for the keyword “VrApi”:

logcat -s VrApi

The result will be a full string, but the important bit is the following:

FPS=72,Prd=32ms,Tear=0,Early=0

I was digging through the NVIDIA documentation and it mentioned that if you used the Best Effort scheduler a frame rate limit would be applied. I wanted to test with the different schedulers anyway so I switched over to the Equal Share scheduler, which solved the problems listed above as it indeed disabled the frame rate limit. I could see the frame rate going up between 70 and 72. Of course, I also wanted to validate the “best effort” scheduler with frame rate limit disabled, I did this by adding an advanced setting to the VM:

pciPassthru0.cfg.frame_rate_limiter=0

This also resulted in a better experience, and again the frame rate going up to 70-72.

  • « Go to Previous Page
  • Page 1
  • Interim pages omitted …
  • Page 23
  • Page 24
  • Page 25
  • Page 26
  • Page 27
  • Interim pages omitted …
  • Page 123
  • Go to Next Page »

Primary Sidebar

About the Author

Duncan Epping is a Chief Technologist and Distinguished Engineering Architect at Broadcom. Besides writing on Yellow-Bricks, Duncan is the co-author of the vSAN Deep Dive and the vSphere Clustering Deep Dive book series. Duncan is also the host of the Unexplored Territory Podcast.

Follow Us

  • X
  • Spotify
  • RSS Feed
  • LinkedIn

Recommended Book(s)

Advertisements


Copyright Yellow-Bricks.com © 2025 · Log in