Today I decided to start testing the vBenchmark fling. It sounded like a cool tool so I installed it in my lab. You can find the fling here for those wanting to test it themselves. So what doe the tool do? The VMware Labs website summarizes it in a good way:
Have you ever wondered how to quantify the benefits of virtualization to your management? If so, please consider using vBenchmark. vBenchmark measures the performance of a VMware virtualized infrastructure across three categories:
- Efficiency: for example, how much physical RAM are you saving by using virtualization?
- Operational Agility: for example, how much time do you take on average to provision a VM?
- Quality of Service: for example, how much downtime do you avoid by using availability features?
vBenchmark provides a succinct set of metrics in these categories for your VMware virtualized private cloud. Additionally, if you choose to contribute your metrics to the community repository, vBenchmark also allows you to compare your metrics against those of comparable companies in your peer group. The data you submit is anonymized and encrypted for secure transmission.
The appliance can be deployed in a fairly simple way:
- Download OVA –> unzip
- Open vCenter client –> File –> Deploy OVF Template
- Select the vBenchmark OVA as a source
- Give it a name, I used used the default (vBenchmark)
- Select a resource pool
- Select a datastore or datastore cluster
- Select the disk format
- Select the appropriate (dv)portgroup
- Fill out the network details
- Finish
Now after it has been deployed you can power it on. When it is powered on check the summary tab and remember the ip-address (for those using dhcp). You can access the web interface on “http://<ip-address>:8080/”.
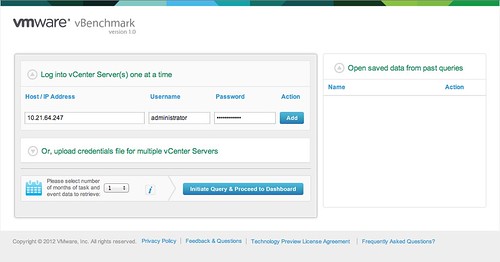
Now you will see a config screen. You can simply enter the details of the vCenter Server of the vSphere environment you want to “analyze” and hit “Initiate Query & Proceed to Dashboard”.
Now comes the cool part. vBenchmark will analyze your environment and provide you with a nice clean looking dashboard… but that is not it. You can decide to upload your dataset to VMware and compare it with “peers”. I tried it and noticed their wasn’t enough data for the peer group I selected. So I decided to select “All / All” to make sure I saw something.

I can understand that many of you don’t want to send data to an “unknown” destination. The good thing is though that you can inspect what is being sent. Before you configure the upload just hit “Preview all data to be sent” and you will get a CSV file of the data set. This data is transported over SSL, just in case you were wondering.
I am going to leave this one running for a while and am looking forward to see what the averages are of my peers. I also am wondering what this tool will evolve in to.
One thing that stood out from the “peer results” is the amount of GBs of Storage per VM: 116.40GB. That did surprise me as I would have estimated this to be around 65GB. Anyway, download it and try it out. It is worth it.