• Skip to primary navigation
  • Skip to main content
  • Skip to primary sidebar

Yellow Bricks

by Duncan Epping

  • Home
  • ESXTOP
  • Stickers/Shirts
  • Privacy Policy
  • About
  • Show Search
Hide Search

fling

Don’t know why DRS is not balancing your cluster? DRS Dump Insight!

Duncan Epping · Aug 27, 2017 ·

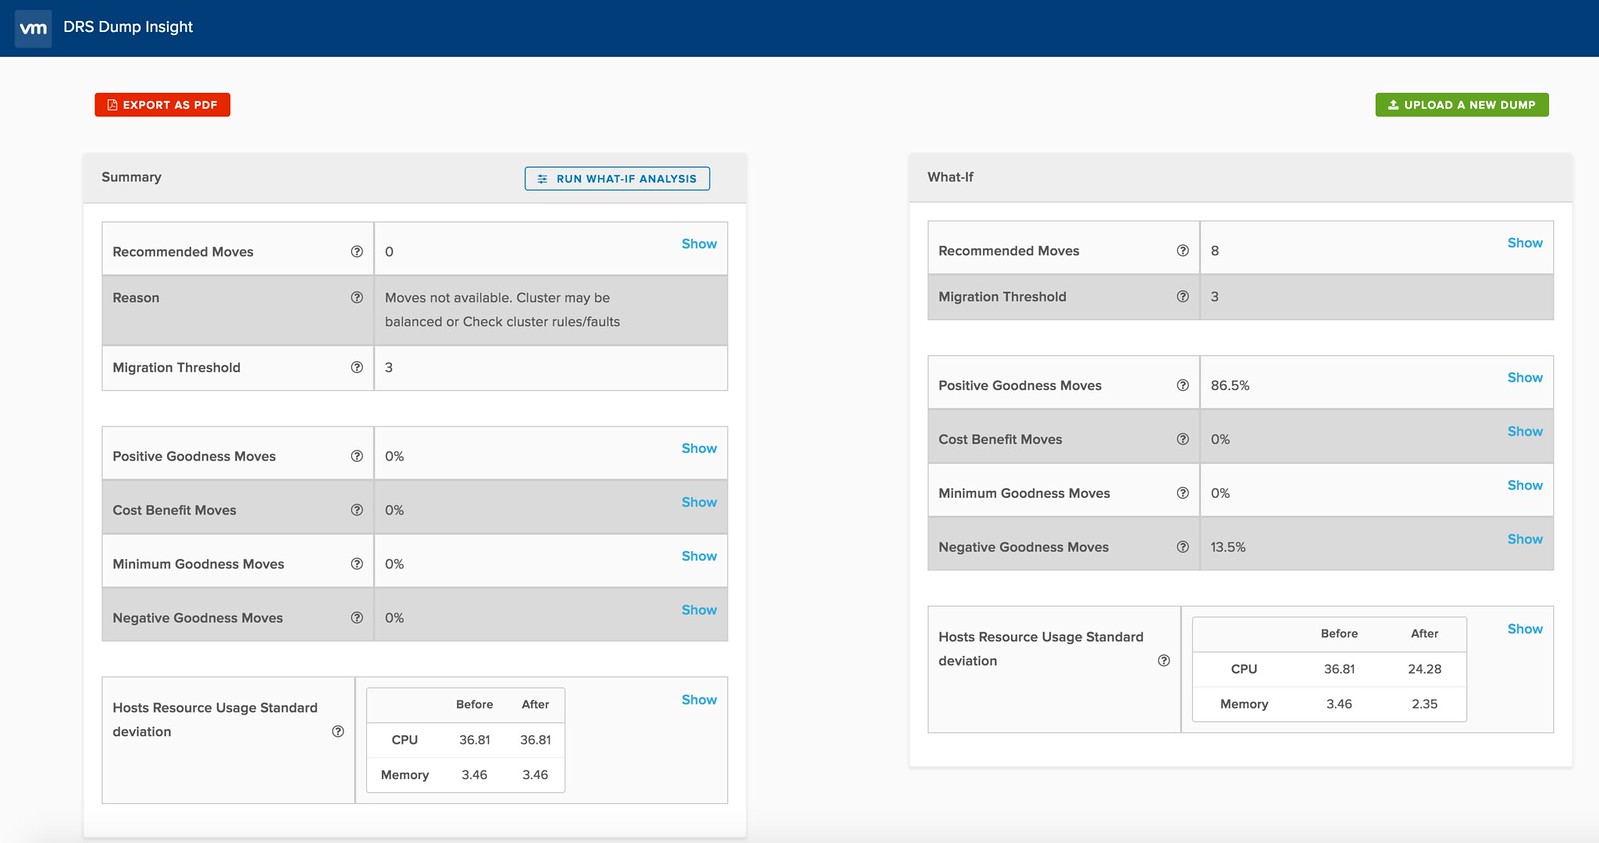
I was just reading up and noticed the DRS Dump Insight solution. It is a SaaS based DRS Dump Analyzer which gives you details around why your cluster is not balanced, or why certain recommendations are not made. Especially the “what if” scenarios are cool if you ask me. You can take a dump and then using the whatif feature check out what would happen to your cluster if for instance all affinity rules were dropped. Or what would happen if the DRS migration threshold is changed, or some advanced settings are used.

You can find some more info about it here, and the SaaS tool here. I hope this will make it in to the product soon in the form of a “health check”… Very useful and insightful! Oh, if you can’t access the website, try it in “Incognito Mode”. Seems there are some issues with the certificate.

New fling: DRS Lens

Duncan Epping · Jul 14, 2017 ·

A cool new fling was just released: DRS Lens. As stated on the flings website:

DRS Lens provides a simple, yet powerful interface to highlight the value proposition of vSphere DRS. Providing answers to simple questions about DRS will help quell many of the common concerns that users may have. DRS Lens provides different dashboards in the form of tabs for each cluster being monitored.

It tracks things like VM Happiness, balance of the cluster itself, User and System initiated vMotions etc. It truly allow you to dig in to your cluster and it could be very useful during cross cluster rebalancing, or trying to figure out where an imbalance is coming from by correlating different vCenter tasks/events to resource contention / VM unhappiness situations. I hope to see this info in the HTML-5 UI at some point! If you are interested, download the fling, give it a try and provide feedback through the comments, the developers will read those and follow up! https://labs.vmware.com/flings/drs-lens


Cool Tool: VisualEsxtop

Duncan Epping · Jul 8, 2013 ·

My ESXTOP page is still one of the most visited pages I have, it actually comes in on a second spot just right after the HA Deepdive. Every once in a while I revise the page and this week it was time to add VisualEsxtop to the list of tools people should use. I figured I would write a regular blog post first and roll it up in to the page at the same time. So what is VisualEsxtop?

VisualEsxtop is an enhanced version of resxtop and esxtop. VisualEsxtop can connect to VMware vCenter Server or ESX hosts, and display ESX server stats with a better user interface and more advanced features.

That sounds nice right? Lets have a look how it works, this is what I did to get it up and running:

  • Go to “http://labs.vmware.com/flings/visualesxtop” and click “download”
  • Unzip “VisualEsxtop.zip” in to a folder you want to store the tool
  • Go to the folder
  • Double click “visualesxtop.bat” when running Windows (Or follow William’s tip for the Mac)
  • Click “File” and “Connect to Live Server”
  • Enter the “Hostname”, “Username” and “Password” and hit “Connect”
  • That is it…

Now some simple tips:

  • By default the refresh interval is set to 5 seconds. You can change this by hitting “Configuration” and then “Change Interval”
  • You can also load Batch Output, this might come in handy when you are a consultant for instance and a customers sends you captured data, you can do this under: File -> Load Batch Output
  • You can filter output, very useful if you are looking for info on a specific virtual machine / world! See the filter section.
  • When you click “Charts”  and double click “Object Types” you will see a list of metrics that you can create a chart with. Just unfold the ones you need and double click them to add them to the right pane

There are a bunch of other cool features in their like color-coding of important metrics for instance. Also the fact that you can show multiple windows at the same time is useful if you ask me and of course the tooltips that provide a description of the counter! If you ask me, a tool everyone should download and check out.

If you have feedback, make sure to leave a comment on the flings site as the engineers of this tool will be tracking that to see where improvements can be made.


Awesome Fling: vCenter 5.1 Pre-Install Check

Duncan Epping · Mar 22, 2013 ·

One of the things that many people have asked me is how they could check if their environment was meeting the requirements for an upgrade to 5.1. Until today I never really had a good answer for it but fortunately that has changed. Alan Renouf has spent countless of hours developing a script that validated your environment and assesses if it is ready for an upgrade to vSphere 5.1.

This is a PowerShell script written to help customers validate their environment and assess if it is ready for a 5.1.x upgrade. The script checks against known misconfiguration and issues raised with VMware Support. This script checks the Windows Server and Active Directory configuration and provides an on screen report of known issues or configuration issues, the script also provides a text report which can help with further trouble shooting.

Is that helpful or what? Instead of going through the motion your just run this pre-flight script and it will tell you if you are good to go or not, or if changes are required. If you are planning an upgrade or are about to upgrade make sure to run this script.

Awesome job Alan, lets keep these coming!

Fling: vBenchmark 1.0.1 just released

Duncan Epping · Apr 4, 2012 ·

An update to the recently released fling vBenchmark was just posted. This update includes some fixes and a feature request which was heard often… Here is what’s new/fixed with 1.0.1:

  • Added a checkbox to include or exclude vCenter license keys when submitting the data to the community repository
  • The application now listens on port 443 (https), requests to port 80 will be automatically redirected to 443
  • The appliance will now prompt you to change the root password at first logon
  • Fixed bugs that prevented some customers from proceeding to the dashboard when they have ESX 3.x hosts in their cluster or are using vCenter credentials that did not have access to the full inventory
  • vBenchmark application log is now written to the VM serial port. If you are using the VMX package, the serial port output will be redirected to a file named vBenchmark.log in the virtual machine folder. If you are importing an OVA or OVF, you need to manually add a serial port device and specify a filename.

Make sure to download the latest version of vBenchmark and try it out! If you don’t have a clue what it does, check out my introduction post here…

  • Go to page 1
  • Go to page 2
  • Go to Next Page »

Primary Sidebar

About the author

Duncan Epping is a Chief Technologist in the Office of CTO of the Cloud Platform BU at VMware. He is a VCDX (# 007), the author of the "vSAN Deep Dive", the “vSphere Clustering Technical Deep Dive” series, and the host of the "Unexplored Territory" podcast.

Upcoming Events

Feb 9th – Irish VMUG
Feb 23rd – Swiss VMUG
March 7th – Dutch VMUG
May 24th – VMUG Poland
June 1st – VMUG Belgium

Recommended Reads

Sponsors

Want to support Yellow-Bricks? Buy an advert!

Advertisements

Copyright Yellow-Bricks.com © 2023 · Log in