• Skip to primary navigation
  • Skip to main content
  • Skip to primary sidebar

Yellow Bricks

by Duncan Epping

  • Home
  • ESXTOP
  • Stickers/Shirts
  • Privacy Policy
  • About
  • Show Search
Hide Search

vm monitoring

I discovered .PNG files on my datastore, can I delete them?

Duncan Epping · Sep 26, 2019 ·

I noticed this question on Reddit about .PNG which were located in VM folders on a datastore. The user wanted to remove the datastore from the cluster but didn’t know where these files were coming from and if the VM required those files to be available in some shape or form. I can be brief about it, you can safely delete this .PNG files. These files are typically created by VM Monitoring (part of vSphere HA) when a VM is rebooted by VM Monitoring. This is to ensure you can troubleshoot the problem potentially after the reboot has occurred. So it takes a screenshot of the VM to for instance capture the blue screen of death. This feature has been in vSphere for a while, but I guess most people have never really noticed it. I wrote an article about it when vSphere 5.0 was released and below is the screenshot from that article where the .PNG file is highlighted. For whatever reason I had trouble finding my own article on this topic so I figured I would write a new one on it. Of course, after finishing this post I found the original article. Anyway, I hope it helps others who find these .PNG files in their VM folders.
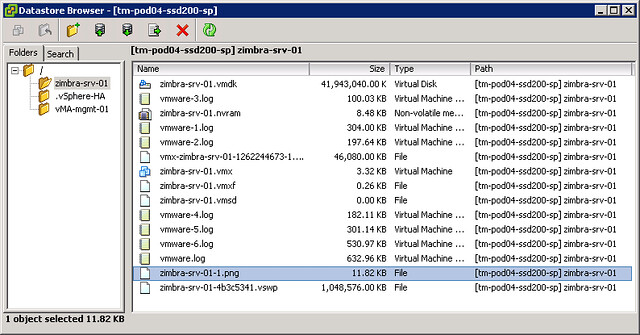
Oh, and I should have added, it can also be caused by vCloud Director or be triggered through the API, as described by William in this post from 2013.

vSphere HA – VM Monitoring sensitivity

Duncan Epping · May 14, 2013 ·

Last week there was a question on VMTN about VM Monitoring sensitivity. I could have sworn I did an article on that exact topic, but I couldn’t find it. I figured I would do a new one with a table explaining the levels of sensitivity that you can configure VM Monitoring to.

The question that was asked was based on a false positive response of VM Monitoring, in this case the virtual machine was frozen due to the consolidation of snapshots and VM Monitoring responded by restarting the virtual machine. As you can imagine the admin wasn’t too impressed as it caused downtime for his virtual machine. He wanted to know how to prevent this from happening. The answer was simple, change the sensitivity as it is set to “high” by default.

As shown in the table high sensitivity means that VM Monitoring responds to missing “VMware Tools heartbeat” within 30 seconds. However, before VM Monitoring restarts the VM though it will check if their was any storage or networking I/O for the last 120 seconds (advanced setting: das.iostatsInterval). If the answer is no to both, the VM will be restarted. So if you feel VM Monitoring is too aggressive, change it accordingly!

Sensitivity Failure Interval Max Failures Max Failures Time window
Low 120 seconds 3 7 days
Medium 60 seconds 3 24 hours
High 30 seconds 3 1 hour

Do note that you can change the above settings individually as well in the UI, as seen in the screenshot below. For instance you could manually increase the failure interval to 240 seconds. How you should configure it is something I cannot answer, it should be based on what you feel is an acceptable response time to a failure. Also, what is the sweet spot to avoid a false positive… A lot to think about indeed when introducing VM Monitoring.

vSphere 5.0 HA: Application Monitoring intro

Duncan Epping · Aug 11, 2011 ·

I don’t think anyone has blogged about App Monitoring yet so I figured I would do a “what’s new / intro” to App Monitoring in vSphere 5.0. Prior to vSphere 5 App Monitoring could only be leveraged by partners which had access to the SDK/APIs. A handful of partners leveraged those of which probably Symantec’s ApplicationHA is the best example. The “problem” with that though is that you would still need to buy a piece of software while you might have in-house development who could easily bake this into their application… well with vSphere 5 you can. I grabbed one of the latest code drops and started playing around. Note that I am not going to do an extensive article on this. Just showing what you have after installing the package. In my case I installed it on a Windows VM.

Now first of all after installing the package you will have new executable. This executable allows you to control App Monitoring offers without the need to compile a full binary yourself. This new command, vmware-appmonitoring.exe, takes the following arguments, which are not coincidentally similar to the functions I will show in a second:

  • Enable
  • Disable
  • markActive
  • isEnabled
  • getAppStatus

When running the command the following output is presented:

C:\VMware-GuestAppMonitorSDK\bin\win32>vmware-appmonitor.exe
Usage: vmware-appmonitor.exe {enable | disable | markActive | isEnabled | getApp Status}

Now I guess most parameters speak for itself. “Enable” will allow you to switch on App Monitoring and “Disable” turns it off again. “IsEnabled” will give you the current status, is it on or off? The “getAppStatus” tells what the status is of your app, is it healthy and has it been sending heartbeats regularly, well than the result will be green if there is a real issue than it will be red. (There’s also gray which means HA just picked up on the VM it’s status needs to be cleared and monitoring should be started soon) Now the one that is most important is “markActive”. This parameter needs to be called at least every 30 seconds. This is the heartbeat parameter. In other words “markActive” is what informs HA that the application is still alive!

I am sure that as soon as William Lam gets his hands on the package he will go wild and release a bunch of scripts which will allow you to enhance resiliency for application/service. These parameters can also be used by your development team, but in the form of a function. The Application Awareness API allows for anyone to talk to it using different types of languages like C++ and Java for instance. Currently there are 6 functions defined:

  • VMGuestAppMonitor_Enable()
    Enables Monitoring
  • VMGuestAppMonitor_MarkActive()
    Mark application as active, recommend to call this at least every 30 seconds
  • VMGuestAppMonitor_Disable()
    Disable Monitoring
  • VMGuestAppMonitor_IsEnabled()
    Returns status of Monitoring
  • VMGuestAppMonitor_GetAppStatus()
    Returns the current application status recorded for the application
  • VMGuestAppMonitor_Free()
    Frees the result of the VMGuestAppMonitor_GetAppStatus() call

These functions could be used by your development team to enhance resiliency in a simple way. This is just the start however, I personally would like to see some sort of rolling patch process added on top and for instance the ability to restart service or have a partial VM failure. Or even the hint the hypervisor that there is a partial failure and request a vMotion to a different host to validate if that solves the problem… If you feel there’s something that needs to be added to App Monitoring let me know and I’ll make sure the PM/Dev Team reads this thread.

** disclaimer: some of this info was taken from the vSphere 5.0 Technical Deepdive book **

Testing VM Monitoring on vSphere 5.0

Duncan Epping · Jul 20, 2011 ·

I was testing VM Monitoring and needed to trigger a Blue Screen of Death. Unfortunately the “CrashOnCtrlScroll” solution did not work so I needed a different solution. I finally managed to get it sorted by doing the following:

Add the following key to your registry by doing a copy and paste of the following line, note that I had to break up the line to make it viewable on my blog unfortunately:

reg add "HKEY_LOCAL_MACHINE\SYSTEM\CurrentControlSet\Control\CrashControl"
/v NMICrashDump /t REG_DWORD /d 0x1 /f

List all VMs running on the host to get the World ID of the VM, SSH into your ESXi 5.0 host and type the following:

esxcli vm process list

Write down or copy the world ID of the VM and send an NMI request to trigger the BSOD, replace “<world id>” with the appropriate ID:

vmdumper <world id vm> nmi

This results in a nice BSOD and followed by a reboot by VM Monitoring including a screenshot of the VMs console (see screenshot below) before the reboot.

I discovered .PNG files on my datastore, can I delete them?

HA, the missing link…

Duncan Epping · Oct 20, 2010 ·

One of the things that has always been missing from VMware’s High Availability solution stack is application awareness. As I explained in one of my earlier posts this is something that VMware is actively working on. Instead of creating a full App clustering level VMware decided to extend “VM Monitoring” and created an API to enable App level resiliency.

At VMworld I briefly sat down with Tom Stephens who is part of the Technical Marketing Team as an expert on HA and of course the recently introduced App Monitoring. Tom explained me what App Monitoring enables our partners to do and he used Symantec as the example. Symantec monitors the Application and all its associated services and ensure appropriate action is taken depending on the type of failure. Now keep in mind, it is still a single node so in case of OS maintenance their will be a short downtime. However, I personally feel that this does bridge a gap, this could add that extra 9 and that extra level of assurance your customer needs for his tier-1 app.

Not only will it react to a failover, but it also ensures for instance that all service are stopped and started in the correct order if and when needed. Now think about that for a second, you are doing maintenance during the weekend and need to reboot some of the Application Servers which are owned by someone else. This feature would enable you to reboot the machine and guarantee that the App will be started correctly as it knows the dependencies!

Tom recently published a great article about this new HA functionality and the key benefits of it, make sure you read it on the VMware Uptime blog!

  • Go to page 1
  • Go to page 2
  • Go to Next Page »

Primary Sidebar

About the author

Duncan Epping is a Chief Technologist in the Office of CTO of the Cloud Platform BU at VMware. He is a VCDX (# 007), the author of the "vSAN Deep Dive", the “vSphere Clustering Technical Deep Dive” series, and the host of the "Unexplored Territory" podcast.

Upcoming Events

May 24th – VMUG Poland
June 1st – VMUG Belgium

Recommended Reads

Sponsors

Want to support Yellow-Bricks? Buy an advert!

Advertisements

Copyright Yellow-Bricks.com © 2023 · Log in