• Skip to primary navigation
  • Skip to main content
  • Skip to primary sidebar

Yellow Bricks

by Duncan Epping

  • Home
  • Unexplored Territory Podcast
  • HA Deepdive
  • ESXTOP
  • Stickers/Shirts
  • Privacy Policy
  • About
  • Show Search
Hide Search

performance

Performance of vCenter 5.0 in Remote Offices and Branch Offices (ROBO) white paper

Duncan Epping · Jun 19, 2012 ·

I just finished reading the “Performance of VMware vCenter 5.0 in remote offices and branch offices (ROBO)” white paper. I thought it was an excellent read and recommend it to anyone who has a ROBO environment. Also it is interesting to know what kind of traffic hosts / VMs drive in general to vCenter. Especially the details around the statistics level are worth reading for those deploying larger environments as it also gives a sense of the amount of data that vCenter is processing.

Nice work Fei Chen! You can find the paper here:

Performance of VMware vCenter 5.0 in Remote Offices and Branch Offices (ROBO)
This document details the performance of typical vCenter 5.0 operations in a use case where vCenter manages ESXi hosts over a network with limited bandwidth and high latency, which is also known as a remote office, branch office (ROBO) environment.

(Although the date stamp on this entry says 2010 it is a June / 2012 paper, I will try to get this fixed!)
Cool tool: vBenchmark fling

Duncan Epping · Feb 29, 2012 ·

Today I decided to start testing the vBenchmark fling. It sounded like a cool tool so I installed it in my lab. You can find the fling here for those wanting to test it themselves. So what doe the tool do? The VMware Labs website summarizes it in a good way:

Have you ever wondered how to quantify the benefits of virtualization to your management? If so, please consider using vBenchmark. vBenchmark measures the performance of a VMware virtualized infrastructure across three categories:

  • Efficiency: for example, how much physical RAM are you saving by using virtualization?
  • Operational Agility: for example, how much time do you take on average to provision a VM?
  • Quality of Service: for example, how much downtime do you avoid by using availability features?

vBenchmark provides a succinct set of metrics in these categories for your VMware virtualized private cloud. Additionally, if you choose to contribute your metrics to the community repository, vBenchmark also allows you to compare your metrics against those of comparable companies in your peer group. The data you submit is anonymized and encrypted for secure transmission.

The appliance can be deployed in a fairly simple way:

  • Download OVA –> unzip
  • Open vCenter client –> File –> Deploy OVF Template
  • Select the vBenchmark OVA as a source
  • Give it a name, I used used the default (vBenchmark)
  • Select a resource pool
  • Select a datastore or datastore cluster
  • Select the disk format
  • Select the appropriate (dv)portgroup
  • Fill out the network details
  • Finish

Now after it has been deployed you can power it on. When it is powered on check the summary tab and remember the ip-address (for those using dhcp). You can access the web interface on “http://<ip-address>:8080/”.

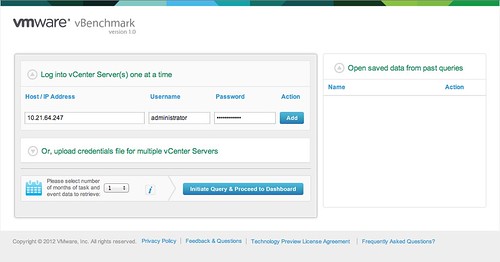
Now you will see a config screen. You can simply enter the details of the vCenter Server of the vSphere environment you want to “analyze” and hit “Initiate Query & Proceed to Dashboard”.

Now comes the cool part. vBenchmark will analyze your environment and provide you with a nice clean looking dashboard… but that is not it. You can decide to upload your dataset to VMware and compare it with “peers”. I tried it and noticed their wasn’t enough data for the peer group I selected. So I decided to select “All / All” to make sure I saw something.

I can understand that many of you don’t want to send data to an “unknown” destination. The good thing is though that you can inspect what is being sent. Before you configure the upload just hit “Preview all data to be sent” and you will get a CSV file of the data set. This data is transported over SSL, just in case you were wondering.

I am going to leave this one running for a while and am looking forward to see what the averages are of my peers. I also am wondering what this tool will evolve in to.

One thing that stood out from the “peer results” is the amount of GBs of Storage per VM: 116.40GB. That did surprise me as I would have estimated this to be around 65GB. Anyway, download it and try it out. It is worth it.

vNUMA and vMotion

Duncan Epping · Oct 28, 2011 ·

I was listening to some VMworld talks during the weekend and something caught my attention which I hadn’t realized before. The talk I was listening to was VSP2122″VMware vMotion in vSphere 5.0, Architecture and Performance”. Now this probably doesn’t apply to most of the people reading this so let me set the scenario first:

  • Different hosts from a CPU/Memory perspective in a single cluster (different NUMA topology)
  • VMs with more than 8 vCPUs

Now the thing is that the vNUMA topology is set for a given VM during the power-on. This is based on the NUMA topology of the physical host that has received the power-on request. When you move a VM to a host which has a different NUMA topology then it could result in reduced performance. This is also described in the Performance Best Practices whitepaper for vSphere 5.0. A nice example of how you can benefit from vNUMA is explained in the recently released academic paper “Performance Evaluation of HPC Benchmarks on VMware’s ESXi Server“.

I’ve never been a huge fan of mixed clusters due to complications it adds around resource management and availability, but this is definitely another argument to try to avoid it where and when possible.

Memory Speeds?

Duncan Epping · Oct 10, 2011 ·

I was just checking out some of the VMworld Sessions and one that I really enjoyed was the one on “Memory Virtualization” session by Kit Colbert and YP Chien (#VSP2447). This session has a lot of nuggets but something I wanted to share is this script that YP Chien / Kingston showed up on stage. This script basically shows you at what speed your memory is capable of runing at. I asked Alan Renouf if he could test it as my lab is undergoing heavy construction. He tested it and mailed me back the output of the following script:

$cred = Get-Credential
$sessOpt = New-WSManSessionOption -SkipCACheck -SkipCNCheck -SkipRevocationCheck
$rsrcURI = "http://schemas.dmtf.org/wbem/wscim/1/cim-schema/2//CIM_PhysicalMemory"
foreach ($h in (Get-VMHost)) {
Write-Output $h.Name
Get-WSManInstance -ConnectionURI ("https`://" + $h.Name + "/wsman") -Authentication basic -Credential $cred -Enumerate -Port 443 -UseSSL -SessionOption $sessOpt -ResourceURI $rsrcURI | Select ElementName, @{N="Capacity (GB)";E={$_.Capacity / 1073741824.}}, MaxMemorySpeed
}

The output will look like this:

hostname01.local
ElementName    : DIMM1
Capacity (GB)  : 2
MaxMemorySpeed : 800

hostname02.local
ElementName    : DIMM1
Capacity (GB)  : 2
MaxMemorySpeed : 800

For those wondering what more you can get from CIM I would suggest reading this great article on the VMware PowerCLI blog.

vSphere 5.0 – what’s new for esxtop

Duncan Epping · Oct 4, 2011 ·

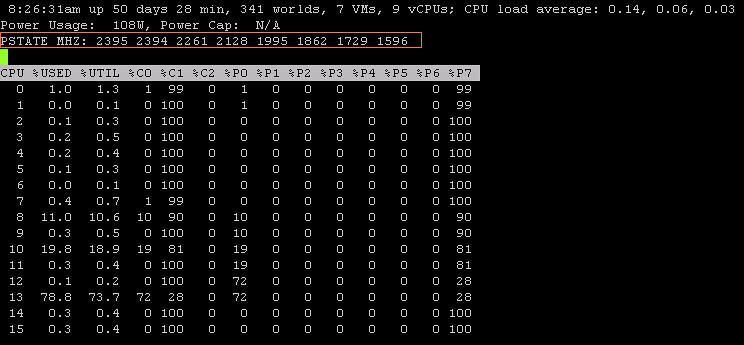
I was just playing around with esxtop in vSphere 5.0 and spotted something that changed. I figured there must be more so I started digging. I didn’t dig too deep as there is a great VMworld session (VSP1999) on this topic by Krishna Raj Raja and I figured why re-invent the wheel. Anyway, here’s the things I noticed which will definitely come in handy at some point while troubleshooting performance issues:

  • Each display type now shows the number of Worlds, VMs and vCPUs on the host on the first line. This will allow you to quickly identify why there for instance is a high %RDY.
  • %VMWAIT is a derivitive of %WAIT, however it does not include IDLE time and only %SWPWT and “blocked”. It could for instance also be blocked when the connectivity to the storage device has failed.
  • In the Power display there’s a new line which is PSTATE MHZ. This shows you the different clock frequencies per state. For instance “2395” is the clock frequency of %P0 and “1596” is the clock frequency of %P7. Please note that “%USED” is based on the base (%P0) of your CPU. %UTIL is the utilization in it’s current state (%Px), so in this case that could be 40% of %P7 (1596) which is 638.
  • In the “Device Display” there are new stats starting with “F”, for example FCMDs, these show the failed I/Os. Fairly quick way to see if there are any I/O errors.
  • These two new counters in the “Memory Display”, LLSWR/s / LLSWW/s, show the amount of memory being written to host cache or read from host cache. Useful when you have enabled this feature and want to know if it is actively being used. Of course there are also vCenter stats for this one.

I love esxtop, with 5.0 is has become even better and especially “%VMWAIT” and the PSTATE details will come in handy at some point in time!

  • « Go to Previous Page
  • Page 1
  • Page 2
  • Page 3
  • Page 4
  • Page 5
  • Page 6
  • Interim pages omitted …
  • Page 21
  • Go to Next Page »

Primary Sidebar

About the Author

Duncan Epping is a Chief Technologist and Distinguished Engineering Architect at Broadcom. Besides writing on Yellow-Bricks, Duncan is the co-author of the vSAN Deep Dive and the vSphere Clustering Deep Dive book series. Duncan is also the host of the Unexplored Territory Podcast.

Follow Us

  • X
  • Spotify
  • RSS Feed
  • LinkedIn

Recommended Book(s)

Advertisements


Copyright Yellow-Bricks.com © 2025 · Log in