This week we(Frank Denneman and I) played around with vscsiStats, it’s a weird command and hard to get used to when you normally dive into esxtop when there are performance issues. While asking around for more info on the metrics and values someone emailed us nfstop. I assumed it was NDA or at least not suitable for publication yet but William Lam pointed me to a topic on the VMTN Communities which contains this great script. Definitely worth checking out. This tool parses the vscsiStats output into an esxtop format. Below a screenshot of what that looks like:
performance
vscsiStats
I was doing performance troubleshooting with Frank Denneman this week and we wanted to use “vscsiStats” to verify if there was any significant latency.
We checked multiple whitepapers before we went onsite and our primary source was this excellent article by Scott Drummonds. After start vscsiStats and receiving a “successful started” we waited for 15 minutes and verified if we could see any data at all. Unfortunately we did not see anything. What is happening here? We checked the build/patch level and it was ESX 3.5 Update 4. Nothing out of the ordinary I would say. After trying several VMs we still did not see anything with “vscsiStats -s -w <worldID>”. For some weird reason, in contrary to what all blog articles are stating and what Scott Drummonds states we had to use the following command:
vscsiStats -s -t -w <worldID>
This might not be the case in most situations, but again we had to add “-t” to capture any data. You can find the world ID of the VM you want to monitor the performance by using the following command:
vscsiStats -l
After a couple of minutes you can verify if any data is being collected by using the following command:
vscsiStats -p all -w <worldID>
If you want to save your data in a CSV file to import it in Excel use the following:
vscsiStats -p all -c -w <worldID> > /tmp/vmstats-<vmname>.csv
Don’t forget to stop the monitoring:
vscsiStats -x -w <worldID>
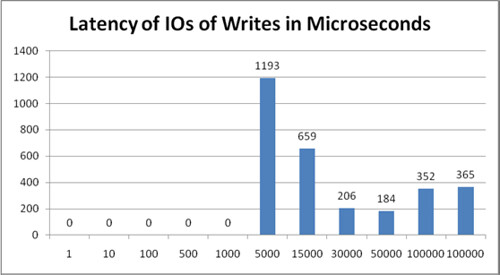
So what’s the outcome of this all? Well with vscsiStats you can create great diagrams which for instance show the latency. This can be very useful in NFS environments as esxtop does not show this info:
If you don’t want to do this by hand, check out this article by Gabe.
EMC Powerpath/VE
My colleague Lee Dilworth, SRM/BC-DR Specialist, pointed me out to an excellent whitepaper by EMC. This whitepaper describes the difference between Powerpath/VE and MRU, Fixed and Round Robin.
Key results:
- Powerpath/VE provides superior load-balancing performance across multiple paths using FC or iSCSI.
- Powerpath/VE seamlessly integrates and takes control of all device I/O, path selection, and failover without the need for additional configuration.
- VMware NMP requires that certain configuration parameters be specified to achieve improved performance.
I recommend reading the whitepaper to get a good understanding of where a customer would benefit from using EMC Powerpath/VE. The whitepaper gives a clear picture of the load balancing capabilities of Powerpath/VE compared to MRU, Fixed and Round Robin. It also shows that there’s less manual configuration to be done when using Powerpath/VE, and as just revealed by Chad Sakac on twitter an integrated patching solution will be introduced with ESX/vCenter 4.0 Update 1!
Fixed: Memory alarms triggered with AMD RVI and Intel EPT?
I wrote about two weeks ago and back in March but the issues with false memory alerts due to large pages being used have finally been solved.
Fixes an issue where a guest operating system shows high memory usage on Nehalem based systems, which might trigger memory alarms in vCenter. These alarms are false positives and are triggered only when large pages are used. This fix selectively inhibits the promotion of large page regions with sampled small page files. This provides a specific estimate instead of assuming a large page is active when one small page within it is active.
BEFORE INSTALLING THIS PATCH: If you have set Mem.AllocGuestLargePage to 0 to workaround the high memory usage issue detailed in the Summaries and Symptoms section, undo the workaround by setting Mem.AllocGuestLargePage to 1.
Six patches have been released today but this fix was probably the one that people talk about the most that’s why I wanted to make everyone aware of it! Download the patches here.
Memory alarms triggered with AMD RVI and Intel EPT?
I’ve reported on this twice already but it seems a fix will be offered soon. I discovered the problem back in March when I did a project where we virtualized a large amount of Citrix XenApp servers on an AMD platform with RVI capabilities. As Hardware MMU increased performance significantly it was enabled by default for 32Bit OS’es. This is when we noticed that large pages(side effect of enabling MMU) are not TPS’ed and thus give a totally different view of resource consumption than on your average cluster. When vSphere and Nehalem was released more customers experienced this behavior, as EPT(Intel’s version of RVI) is fully supported and utilized on vSphere, as reported in this article. To be absolutely clear: large pages were never supposed to be TPS’ed and this is not a bug but actually working as designed. However; we did discover an issue with the algorithm being used to calculate Guest Active Memory which causes the alarms to be triggered as “kichaonline” describes in this reply.
I’m not going to reiterate everything that has been reported in this VMTN Topic about the problem, but what I would like to mention is that a patch will be released soon to fix the incorrect alarms:
Several people have, understandably, asked about when this issue will be fixed. We are on track to resolving the problem in Patch 2, which is expected in mid to late September.
In the meantime, disabling large page usage as a temporary work-around is probably the best approach, but I would like to reiterate that this causes a measurable loss of performance. So once the patch becomes available, it is a good idea to go back and reenable large pages.
Also a small clarification. Someone asked if the temporary work-around would be “free” (i.e., have no performance penalty) for Win2k3 x64 which doesn’t enable large pages by default. While this may seem plausible, it is however not the case. When running a virtual machine, there are two levels of memory mapping in use: from guest linear to guest physical address and from guest physical to machine address. Large pages provide benefits at each of these levels. A guest that doesn’t enable large pages in the first level mapping, will still get performance improvements from large pages if they can be used for the second level mapping. (And, unsurprisingly, large pages provide the biggest benefits when both mappings are done with large pages.) You can read more about this in the “Memory and MMU Virtualization” section of this document:
http://www.vmware.com/resources/techresources/10036
Thanks,
Ole
Mid / Late september may sound to vague for some and that’s probably why Ole reported the following yesterday:
The problem will be fixed in Patch 02, which we currently expect to be available approximately September 30.
Thanks,
Ole