• Skip to primary navigation
  • Skip to main content
  • Skip to primary sidebar

Yellow Bricks

by Duncan Epping

  • Home
  • Unexplored Territory Podcast
  • HA Deepdive
  • ESXTOP
  • Stickers/Shirts
  • Privacy Policy
  • About
  • Show Search
Hide Search

performance

VMware Desktop Reference Architecture Workload Simulator (RAWC) 1.1

Duncan Epping · Apr 29, 2010 ·

VMware has just released version 1.1 of the VMware Desktop Reference Architecture Workload Simulator (RAWC). As I know many of my readers are actively working on View projects I thought it might be of interest for you.

VMware Desktop Technical Marketing & TS Research Labs are jointly announcing the availability of VMware Desktop Reference Architecture Workload Simulator (RAWC) version 1.1.    With RAWC 1.1, Solution Providers can better anticipate and plan for infrastructure requirements to support successful VMware View deployments for Windows 7 Migration.

RAWC 1.1 now simulates user workloads in Windows 7 environments and can be used to validate VMware View designs to support Windows 7 Migrations.  RAWC 1.1 supports the following desktop applications in Windows 7 and Windows XP environments: Microsoft Office 2007, Microsoft Outlook, Microsoft Internet Explorer, Windows Media Player, Java code compilation simulator, Adobe Acrobat, McAfee Virus Scan, and 7-Zip.

RAWC 1.1 also includes bug fixes and several enhancements in test run configurations, usability and user interface.  Please see RAWC 1.1 product documents for more details.

VMware partners can download RAWC 1.1 software and the product documents from VMware Partner Central:Sales Tools > Services IP.

World record price/performance by ParAccel on VMware

Duncan Epping · Apr 12, 2010 ·

On twitter Scott Drummonds just posted that VMware has submitted TPC-H benchmarks. Not only did they submit the benchmark VMware managed set a new world record for price/performance!

VMware ranked first with $ 0.70 Query-per-Hour Performance. The question of course is why is this important? It is important because TPC is a recognized industry leading benchmark and results can be used for customer discussion where effectiveness on high performance environment is in doubt.

The performance metric reported by TPC-H is called the TPC-H Composite Query-per-Hour Performance Metric (QphH@Size), and reflects multiple aspects of the capability of the system to process queries. These aspects include the selected database size against which the queries are executed, the query processing power when queries are submitted by a single stream, and the query throughput when queries are submitted by multiple concurrent users. The TPC-H Price/Performance metric is expressed as $/QphH@Size.

Generating load?

Duncan Epping · Apr 9, 2010 ·

Every once in a while you would want to stress a VM or multiple VMs to test the working of for instance VMware DRS. There are multiple tools available but most of them only focus on CPU and are usually not multithreaded. My colleague Andres Mitchell developed a cool tool which will load a multithreaded CPU load and will generate memory load.

Andrew tweeted about this tool this week and I tested it today. It looks great and it works great.

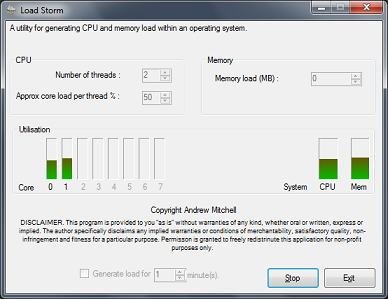
Saw some tweets wanting ways to generate load in a VM. Here’s one I prepared earlier: http://bit.ly/9A39Xh (multithreaded CPU and mem load). I exchanged a couple of emails with Andrew after this tweet and asked him to write a short explanation of what the tool does:

It’s a pretty simple utility to generate CPU and/or memory load within a virtual machine (or a physical server if you are still living in the dark ages). You can specify the number of threads to generate for CPU load and the approximate load each thread generates. You can also specify how much memory you want the application to consume. There’s a timer so you can configure it to only generate the specified load for a set period of time, and system memory utilisation and system/per core CPU utilisation indicators within the application.

Here’s a screenshot of the app:

Aligning your VMs virtual hard disks

Duncan Epping · Apr 8, 2010 ·

I receive a lot of hits on an old article regarding aligning your VMDKs. This article doesn’t actually explain why it is important but only how to do it. The how is not actually as important in my opinion. I do however want to take the opportunity to list some of the options you have today to align your VMs VMDKs. Keep in mind that some require a license(*) or login for that matter:

  • UberAlign by Nick Weaver
  • mbralign by NetApp(*)
  • vOptimizer by Vizioncore(*)
  • GParted (Free tool, Thanks Ricky El-Qasem).

First let’s explain why alignment is important. Take a look at the following diagram:

In my opinion there is no need to discuss VMFS alignment. Everyone, and if  you don’t you should!, creates their VMFS via vCenter which means it is automatically aligned and you won’t need to worry about it. However you will need to worry about the Guest OS. Take Windows 2003, by default when you install the OS your partition is misaligned. (Both Windows 7 and Windows 2008 create aligned partitions by the way.) Even when you create a new partition it will be misaligned. As you can clearly see in the diagram above every cluster will span multiple chunks. Well actually it depends. I guess that’s the next thing to discuss but first let’s show what an aligned OS partition looks like:

I would recommend everyone to read this document. Although it states at the beginning it is obsolete it still contains relevant details! And I guess the following quote from the vSphere Performance Best Practices whitepaper says it all:

Src
The degree of improvement from alignment is highly dependent on workloads and array types. You might want to refer to the alignment recommendations from your array vendor for further information.

Now you might wonder why some vendors are more effected by misalignment than others. The reason for this is block sizes on the back end. For instance NetApp uses a 4KB block size (correct me if I am wrong). If your filesystem uses a 4KB block size (or cluster size as Microsoft calls it) as well this basically means every single IO will require the array to read or write to two blocks instead of 1 when your VMDK’s are misaligned as the diagrams clearly show.

Now when you take for instance an EMC Clariion it’s a different story. As explained in this article, which might be slightly outdated, Clariion arrays use a 64KB chunk size to write their data which means that not every Guest OS cluster is misaligned and thus EMC Clariion is less effected by misalignment. Now this doesn’t mean EMC is superior to NetApp, I don’t want to get Vaughn and Chad going again ;-), but it does mean that the impact of misalignment is different for every vendor and array/filer. Keep this in mind when migrating and / or creating your design.

What’s the point of setting “–IOPS=1” ?

Duncan Epping · Mar 30, 2010 ·

To be honest and completely frank I really don’t have a clue why people recommend setting “–IOPS=1” by default. I have been reading all these so called best practices around changing the default behaviour of “1000” to “1” but none of these contain any justification. Just to give you an example take a look at the following guide: Configuration best practices for HP StorageWorks Enterprise Virtual Array (EVA) family and VMware vSphere 4. The HP document states the following:

Secondly, for optimal default system performance with EVA, it is recommended to configure the round robin load balancing selection to IOPS with a value of 1.

Now please don’t get me wrong, I am not picking on HP here as there are more vendors recommending this. I am however really curious how they measured “optimal performance” for the HP EVA. I have the following questions:

  • What was the workload exposed to the EVA?
  • How many LUNs/VMFS volumes were running this workload?
  • How many VMs per volume?
  • Was VMware’s thin provisioning used?
  • If so, what was the effect on the ESX host and the array? (was there an overhead?)

So far none of of the vendors have published this info and I very much doubt, yes call me sceptical, that these tests have been conducted with a real life workload. Maybe I just don’t get it but  when consolidating workloads a threshold of a 1000 IOPS isn’t that high is it? Why switch after every single IO? I can imagine that for a single VMFS volume this will boost the performance as all paths will be equally hit and load distribution on the array will be optimal. But for a real life situation where you would have multiple VMFS volumes this effect decreases.  Are you following me? Hmmm, let me give you an example:

Test Scenario 1:

1 ESX 4.0 Host
1 VMFS volume
1 VM with IOMeter
HP EVA and IOPS set to 1 with Round Robin based on the ALUA SATP

Following HP’s best practices the Host will have 4 paths to the VMFS volume. However as the HP EVA is an Asymmetric Active Active array(ALUA) only two paths will be shown as “optimized”. (For more info on ALUA read my article here and Frank’s excellent article here.) Clearly when IOPS is set to 1 and there’s a single VM pushing IOs to the EVA on a single VMFS volume the “stress” produced by this VM would be equally divided on all paths without causing any spiky behaviour. In contrary to what a change of paths every “1000 IOs” might do. Although a 1000 is not a gigantic number it will cause spikes in your graphs.

Now lets consider a different scenario. Let’s take a more realistic one:

Test Scenario 2:

8 ESX 4.0 Hosts
10 VMFS volumes
16 VMs per volume with IOMeter
HP EVA and IOPS set to 1 with Round Robin based on the ALUA SATP

Again each VMFS volume will have 4 paths but only two of those will be “optimized” and thus be used. We will have 160 VMs in total on this 8 Host cluster and 10 VMFS volumes which means 16 VMs per VMFS volume. (Again following all best practices.) Now remember we will only have two optimized paths per VMFS volume and we have 16 VMs driving traffic to a volume, but not only 16 VMs this is also coming from 8 different hosts to these Storage Processors. Potentially each host is sending traffic down every single path to every single controller…

Let’s assume the following:

  • Every VM produces 8 IOps on average
  • Every host runs 20 VMs of which 2 will be located on the same VMFS volume

This means that every ESX host changes the path to a specific VMFS volume every 62 seconds(1000/(2×8)), with 10 volumes that’s a change every 6 seconds on average per host. With 8 hosts in a cluster and just two Storage Processors… You see where I am going? Now I would be very surprised if we would see a real performance improvement when IOPS is set to 1 instead of the default 1000. Especially when you have multiple Hosts running multiple VMs hosted on multiple VMFS volumes. If you feel I am wrong here or work for a Storage Vendor and have access to the scenarios used please don’t hesitate to join the discussion.

<update> Let me point out though that every situation is different, if you have had discussions with your storage vendor based on your specific requirements and configuration and this recommendation was given… Do not ignore it, ask why and if it indeed fits –> implement! Your storage vendor has tested various configurations and knows when to implement what, this is just a reminder that implementing “best practices” blind is not always the best option!</update>

  • « Go to Previous Page
  • Page 1
  • Interim pages omitted …
  • Page 9
  • Page 10
  • Page 11
  • Page 12
  • Page 13
  • Interim pages omitted …
  • Page 21
  • Go to Next Page »

Primary Sidebar

About the Author

Duncan Epping is a Chief Technologist and Distinguished Engineering Architect at Broadcom. Besides writing on Yellow-Bricks, Duncan is the co-author of the vSAN Deep Dive and the vSphere Clustering Deep Dive book series. Duncan is also the host of the Unexplored Territory Podcast.

Follow Us

  • X
  • Spotify
  • RSS Feed
  • LinkedIn

Recommended Book(s)

Advertisements


Copyright Yellow-Bricks.com © 2025 · Log in