• Skip to primary navigation
  • Skip to main content
  • Skip to primary sidebar

Yellow Bricks

by Duncan Epping

  • Home
  • Unexplored Territory Podcast
  • HA Deepdive
  • ESXTOP
  • Stickers/Shirts
  • Privacy Policy
  • About
  • Show Search
Hide Search

esxtop

Did you know? SCSI Reservations…

Duncan Epping · Oct 26, 2010 ·

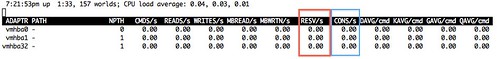
Today we had an interesting discussion on the VCDX mailing list. One thing I noticed a while back when I was randomly looking around in “esxtop” was a new field. The field is called ” RESVSTATS and can be enabled in all disk related displays(d, u,v).

esxtop performance reservations scsi

This will make troubleshooting storage related performance issues a bit easier as the SCSI Reservations(RESV/S) are shown a column(click the screenshot for a larger version) when enabled, and even more specifically SCSI Reservation Conflicts (CONS) are shown next to it):

RT: VMware Event – London – 8th Oct – Not to be missed!

Duncan Epping · Oct 4, 2010 ·

I was just talking to Mr Alan Renouf and it appears that there are a couple of free slots left at the API/PowerCLI event that VMware has organized in coöperation with Alan on the 8th of October in London.

If you are in London on the 8th October 2010 then you could be in for a treat, VMware are arranging a fantastic event, well worth the visit and best of all its free !

The event is called: Managing vSphere in large environments using APIs and PowerCLI

There are limited spaces available so act now or you will miss out, some of the most fantastic minds of VMware will be gracing London with their presence before heading out to VMworld Copenhagen.

Think of this as a taster of the kind of things you can expect from Technology Exchange, the contents are listed below, I would recommend this to any VMware admins who are managing large implementations of vCenter, there will be some great detail in these sessions.

If you would like to attend please send an email to PowerCLIEvent@virtu-al.net with your name and company, this will strictly be on a first come first serve basis as there are limited numbers.

Exploring VMware APIs

Speaker: Preetham Gopalaswamy

vSphere APIs for Performance Monitoring

Speaker: Balaji Parimi, Ravi Soundararajan

Of course Alan really focussed on the API part of the event, but that is not all there is. If you thought my esxtop page was useful, make sure to attend this event as this is the best part of the day in my opinion:

Advanced performance troubleshooting using esxtop

Level: Advanced

Length: 60 minutes

This talk will teach you how to spot tricky performance issues using the various counters in esxtop.

Speaker: Krishna Raj Raja, Staff Engineer, Performance Team

If you are in the UK and can’t make it to VMworld, this is your chance to catch some of the top experts and get to know the API and esxtop inside out!

CMDS/s vs IOPS?

Duncan Epping · Jun 24, 2010 ·

Today I received a question around the difference between IOPS and CMDS/s. The reason for this was the high value of CMDS/s in “esxtop” which exceeded the expected amount of IOPS the disks could actually digest. I thought it would useful for everyone to know what the difference is:

  • IOPS = Input/Output Operations Per Second
    • Within esxtop this would be the outcome of “Number of Read commands(READS/s) + Number of Write commands(WRITES/s)”
  • CMDS/s = Total commands per second
    • Within esxtop this includes any command(for instance SCSI reservations) and not necessary only read/write IOs

One thing to stress though is that in any case the CMDS/s should be relatively close to IOPS, but when there are a lot of metadata changes due to snapshots for instance the difference can be significant. Where this significant difference came from is something we are still investigating and we are hoping to solve pretty soon. If we manage to solve it you can expect an update here.

Is this VM actively swapping? (helping @heiner_hardt)

Duncan Epping · Jun 10, 2010 ·

On twitter @heiner_hardt asked for help with a performance related issue he was experiencing. As I am starting to appreciate esxtop more every single day and I really start to appreciate solving performance problems I decided to dive in to it.

After the initial couple of questions Heiner posted a screenshot:

Heiner highlighted (red outline) a couple of metrics which indicated swapping and ballooning as he pointed out with the text boxes. Although I can’t disagree that swapping and ballooning happened at some point in time I do disagree with the conclusion that this virtual machine is swapping. Lets break it down:

Global Statistics:

  • 1393 Free -> Currently 1393MB memory available
  • High State -> Hypervisor is not under memory pressure
  • SWAP /MB 146 Cur -> 146MB has been swapped
  • SWAP /MB 83 Target -> Target amount that needed to be swapped was 83MB
  • 0.00 r/s -> No reads from swap currently
  • 0.00 w/s -> No writes to swap currently

World Statistics:

  • MCTLSZ 1307.27 -> The amount of guest physical memory that has been reclaimed by the balloon driver is 1307.27MB
  • MCTLTGT 1307.27 -> The amount of guest physical memory to be kept in the balloon driver is 1307.27MB
  • SWCUR 146.61 -> The current amount of memory that has been swapped is 146.61.
  • SWTGT 83.75 -> The target amount of memory that needed to be swapped was 83.75MB

Now that we know what these metrics mean and what the associated values are we can easily draw a conclusion:

At one point the host has most likely been overcommitted. However currently there is no memory pressure (state = high (>6% free memory)) as there is 1393MB of memory available. The metric “swcur” seems to indicate that swapping has occurred” however currently the host is not actively reading from swap or actively writing to swap (0.00 r/s and 0.00 w/s).

If the host is not experiencing memory pressure why is the balloon driver still inflated (MCTLTGT 1307.27MB)? Although the host is currently in a high memory state the amount of available memory almost equals the amount of claimed memory by the balloon driver. However deflating the balloon would return the host to a memory constrained state again.

My recommendation? Cut down on memory on your VMs! The fact that memory has been granted does not necessarily mean it is actively used and in this case it leads to serious overcommitment which in its turn leads to ballooning and even worse swapping.

One thing to point out though is the amount of “PSHARE” (TPS) is compared to average environments low. Might be something to explore!

esxtop -l ?

Duncan Epping · Jun 2, 2010 ·

I received a couple of questions around my esxtop article yesterday so I guess it wasn’t completely clear what “locked” meant. I had a difficult time understanding it myself but I was fortunate enough that one of my colleagues (Thanks Valentin) got to the bottom of it and emailed me the following explanation. I rewrote parts of it and this is the outcome, hope that it clears things up:

As most of you know esxtop takes snapshots from VSI nodes (similar to proc nodes) to capture the running entities and their states. The rate in which these snapshots are taken can be changed with the “s”. The default setting is 5 seconds and the minimum, which most people probably use, is 2 seconds. This means that every entity (worlds, for instance a virtual machine) and the associated info is queried again every two seconds. As many of the metrics shown in esxtop are calculated based on the difference of two successive snapshots, e.g. %USED (CPU), esxtop just rereads all the info(all entities and all values) and calculates the values of the metrics.

As you can imagine this can cause stress on your CPU in a very large environment. The reason for this is the amount of data that needs to be gathered for these entities and the amount of calculations which need to take place. However, with “lock mode” enabled only the changing states from those entities will be read from the VSI nodes. The entities(VMs, Worlds, LUNs etc) themselves will be copied over from the first snapshot that was taken when esxtop was started. This does however mean that when a new helper world is spawned or a virtual machine is powered on or VMotioned to the host it will not appear within esxtop until esxtop is restarted!

Below you see an example of entities and values that will definitely not change as long as esxtop with lock mode is running. All other stats will be updated and you are still free to select whatever fields you want, everything will be available as if nothing happened.

Since those entities and their relations don’t have to be read and calculated every time, esxtop’s CPU consumption will drop significantly. Again, please note that when a new VM is powered on, a VM is vMotion to the host or a new world is created it will not show up within esxtop when “-l” is used as the entities are locked! This also applies to starting esxtop in batch mode with -b.

  • « Go to Previous Page
  • Page 1
  • Page 2
  • Page 3
  • Page 4
  • Go to Next Page »

Primary Sidebar

About the Author

Duncan Epping is a Chief Technologist and Distinguished Engineering Architect at Broadcom. Besides writing on Yellow-Bricks, Duncan is the co-author of the vSAN Deep Dive and the vSphere Clustering Deep Dive book series. Duncan is also the host of the Unexplored Territory Podcast.

Follow Us

  • X
  • Spotify
  • RSS Feed
  • LinkedIn

Recommended Book(s)

Advertisements


Copyright Yellow-Bricks.com © 2025 · Log in