• Skip to primary navigation
  • Skip to main content
  • Skip to primary sidebar

Yellow Bricks

by Duncan Epping

  • Home
  • Unexplored Territory Podcast
  • HA Deepdive
  • ESXTOP
  • Stickers/Shirts
  • Privacy Policy
  • About
  • Show Search
Hide Search

4.0

das.failuredetection time and relationship with isolation response

Duncan Epping · May 27, 2011 ·

I had this question coincidentally two times of the last 3 weeks and I figured that it couldn’t hurt explaining it here as well. The question on the VMTN community was as follows:

on 13 sec: a host which hears from none of the partners will ping the isolation address
on 14 sec: if no reply from isolation address it will trigger the isolation response
on 15 sec: the host will be declared dead from the remaining hosts, this will be confirmed by pinging the missing host
on 16 sec: restarts of the VMs will begin

My first question is: Do all these timings come from the das.failuredetectiontime? That is, if das.failuredetectiontime is set to e.g. 30000 (30 sec) then on the 28th second a potential isolated host will try to ping the isolation address and do the Isolation Response action at 29 second?

Or is the Isolation Response timings hardcoded and always happens at 13 sec?

My second question, if the answer is Yes on above, why is the recommendation to increase das.failuredetectiontime to 20000 if having multiple Isolation Response addresses? If the above is correct then this would make to potential isolated host to test its isolation addresses at 18th second and the restart of the VMs will begin at 21 second, but what would be the gain from this really?

To which my answer was very short fortunately:

Yes, the relationship between these timings is das.failuredetectiontime.

Increasing the das.failuredetectiontime is usually recommended when an additional das.isolationaddress is specified. the reason for this is that the “ping” and the “result of the ping” needs time and by added 5 seconds to the failure detection time you allow for this test to complete correctly. After which the isolation response could be triggered.

After having a discussion on VMTN about this and giving it some thought and bouncing my thoughts with the engineers I came to the conclusion that the recommendation to increase das.failuredetectiontime with 5 seconds when multiple isolation addresses are specified is incorrect. The sequence is always as follows regardless of the value of das.failuredetectiontime:

  • The ping will always occur at “das.failuredetectiontime -2”
  • The isolation response is always triggered at “das.failuredetectiontime -1”
  • The fail-over is always initiated at “das.failuredetectiontime +1”

The timeline in this article explains the process well.

Now, this recommendation to increase das.failuredetectiontime was probably made in times where many customers were experiencing network issues. Increasing the time decreases the chances of running in to an issue where VMs are powered down due to a network outage. Sorry about all the confusion and unclear recommendations.
Did you know? vCloud Director Reservation Pool allocation model fact

Duncan Epping · Dec 15, 2010 ·

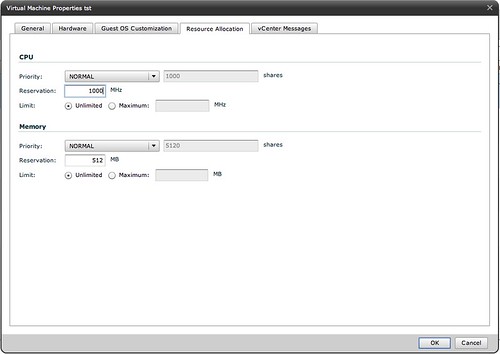
I did not know about this, but someone pointed this out last week and I figured it was worth blogging about as this feature can potentially impact your design. (Think HA admission control policies and resource management)

When you create a VM in an Org vDC which is defined as a Reservation Pool you can actually manually set the shares per type of resource (memory and CPU) and also set a reservation and even a limit if and when needed. Pretty cool, but as you can imagine also very complex at some point to figure out to what it should be set.

Shares set on Resource Pools

Duncan Epping · Dec 14, 2010 ·

During our session at the Dutch VMUG Frank was explaining Resource Pools and the impact of limits and reservations. As I had the feeling not everyone in the room was using resource pools I asked the following questions:

  1. How many people are using Resource Pools today?
    • Out of the roughly 300 people who attended our session 80 showed their hands. The follow-up question I asked was…
  2. How many people change the Shares setting from the default?
    • Out of those 80 hands roughly 20 people raised their hands and that lead me to the next question…
  3. How many people change the Shares value based on the amount of VMs running in that Resource Pool?
    • Now only a handful of people raised their hand.

That is what triggered this post as I believe it is an often made mistake. First of all when you create a Resource Pool there are a couple of things you can set a reservation, a limit and of course shares. For some reason shares are often overlooked. There are a couple of things I wanted to make sure everyone understands as judging by the numbers of hands that were raised I am certain there are a couple of common misunderstandings when it comes to Resource Pools:

  • If you create a Resource Pool a default Shares value is defined for the resource pool on both Memory and CPU
  • Shares specify the priority of the resource pool relative to other resource pools on the same level

This means that even if you don’t touch the shares values they will come into play whenever there is contention. This also means that the resource allocation on a VM level is dependent on the entitlement of the resource pool it belongs to.

Now what is the impact of that? I guess I should quote from the “The Resource Pool Priority-Pie Paradox” blog post my colleague Craig Risinger wrote as it clearly demonstrates the issues that can be encountered when Resource Pools are used and Shares values are not based on the relative priority AND the amount of VMs per pool.

“Test” 1000 shares, 4 VMs => 250 units per VM (small pie, a few big slices):

“Production” 4000 shares, 50 VMs => 80 units per VM (bigger pie, many small slices):

I guess this makes it really obvious that shares might not always give you the results you expected it would.

Another issue that could arise is when Virtual Machines are created on the same level as the Resource Pools…. Believe me it doesn’t take a lot for a single VM to have higher priority than a Resource Pool in times of contention.

Again, whenever you create a Resource Pool it will “inherit” the default shares value, which equals a 4vCPU/16GB Virtual Machine, and whenever there is contention these will come into play. Keep this in mind when designing your virtual infrastructure as it could potentially lead to unwanted results.

Cool Tool: opvizor

Duncan Epping · Dec 7, 2010 ·

Recently Dennis Zimmer, which most of you probably know of Icomasoft or from the books he authored, emailed me about a new tool his company was developing. I watched the video that is hosted on opvizor.com and must admit that it looks promising. Especially as most solutions today are reactive or semi-pro-active and opvizor is aiming to be pro-active.

opvizor identifies in advance when the virtualized IT infrastructure is lo osing on performance or might crash. Issues in VMware environments can be analyzed and corrected before they become dangerous. In addition, opvizor provides optimized logfiles and makes it possible to share the infrastructure data with internal and external partners, thus allowing more efficient problem solving. “Our goal is, that opvizor anticipates 60 percent of issues from system behavior.”

Now the tool just entered the Beta stage and opvizor is looking for people willing to give it a testdrive and willing to provide feedback! Funnily enough the tool kind of reminds me of a great tool we use internally to take vm-support files apart and analyze them. I can assure you that with the right amount of work / commitment this can turn into a really powerful tool to monitor / healthcheck your environment on a regular basis.

VMworld esxtop advanced session

Duncan Epping · Nov 8, 2010 ·

During my flight from Boston back to the Netherlands I listened to the VMworld esxtop session “Troubleshooting using ESXTOP for Advanced Users, TA6720“. As always an excellent session with a lot of in-depth info. Most of it was already documented, however there were a couple of key points that I hadn’t documented yet. I just added those to my esxtop page which I wanted to stress as I personally believe it is very useful info. It seems pretty random but it rolled up nicely into the esxtop page in my opinion.

  • %SYS should be less than 20, %SYS is the percentage of time spent by system services on behalf of the world. The possible system services are interrupt handlers, bottom halves, and system worlds.
  • -b = batch mode, adding “-a” will force all metrics to be gathered
  • Limit display to a single group (l)
    • enables you to focus on a specific VM
  • Limiting the number of entities (#)
    • this enables you for instance to watch the top 5 worlds for

I have also added thresholds for ZIP/s, UNZIP/s and CACHEUSD. These should of course be 0 from a performance perspective as anything larger than 0 means the host was overcommitted on memory and had to resort to memory compression.

If anyone has more metrics/thresholds to contribute which they used in the past to troubleshoot issues let me know!

  • Page 1
  • Page 2
  • Go to Next Page »

Primary Sidebar

About the Author

Duncan Epping is a Chief Technologist and Distinguished Engineering Architect at Broadcom. Besides writing on Yellow-Bricks, Duncan is the co-author of the vSAN Deep Dive and the vSphere Clustering Deep Dive book series. Duncan is also the host of the Unexplored Territory Podcast.

Follow Us

  • X
  • Spotify
  • RSS Feed
  • LinkedIn

Recommended Book(s)

Advertisements


Copyright Yellow-Bricks.com © 2025 · Log in