During my flight from Boston back to the Netherlands I listened to the VMworld esxtop session “Troubleshooting using ESXTOP for Advanced Users, TA6720“. As always an excellent session with a lot of in-depth info. Most of it was already documented, however there were a couple of key points that I hadn’t documented yet. I just added those to my esxtop page which I wanted to stress as I personally believe it is very useful info. It seems pretty random but it rolled up nicely into the esxtop page in my opinion.
- %SYS should be less than 20, %SYS is the percentage of time spent by system services on behalf of the world. The possible system services are interrupt handlers, bottom halves, and system worlds.
- -b = batch mode, adding “-a” will force all metrics to be gathered
- Limit display to a single group (l)
- enables you to focus on a specific VM
- Limiting the number of entities (#)
- this enables you for instance to watch the top 5 worlds for
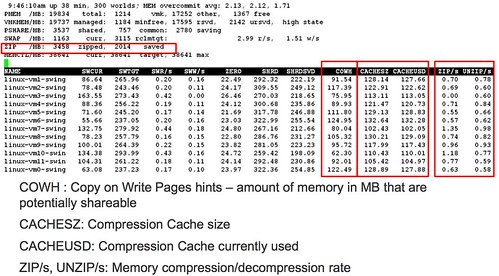
I have also added thresholds for ZIP/s, UNZIP/s and CACHEUSD. These should of course be 0 from a performance perspective as anything larger than 0 means the host was overcommitted on memory and had to resort to memory compression.
If anyone has more metrics/thresholds to contribute which they used in the past to troubleshoot issues let me know!