• Skip to primary navigation
  • Skip to main content
  • Skip to primary sidebar

Yellow Bricks

by Duncan Epping

  • Home
  • Unexplored Territory Podcast
  • HA Deepdive
  • ESXTOP
  • Stickers/Shirts
  • Privacy Policy
  • About
  • Show Search
Hide Search

Management & Automation

Startup intro: Runecast

Duncan Epping · Mar 7, 2017 ·

I met with Runecast a couple of years ago at VMworld. Actually, I am not sure they already had a name back then, I should probably say I met with the guys who ended up founding Runecast at VMworld. One of them, Stan, is a VCDX and back then he pitched this idea to me around an appliance that would analyze your environment based on a set of KBs. His idea was primarily based on his experience managing and building datacenters. (Not just Stan’s experience, but most of the team are actually former IBM employees) Interesting concept, kind of sounded similar to CloudPhysics to me, although the focus was more on correlation of KB then capacity management etc.

Fast forward to 2017 and I just finished a call with the Runecast team. I had a short conversation at VMworld 2016 and was under the impression that they sold the company or quit. None of this is true. Runecast managed to get a 1.6m euro funding (Czech Republic) and is going full steam ahead. With around 10 people, most being in Czech Republic they are ready to release the next version of Runecast Analyzer, which will be 1.5. So what does this provide?

Well just imagine you manage a bunch of hosts and vCenter (not unlikely when you visit my blog), maybe some shared storage along with it. There are many KB articles, frequent updates of these and many newly published KBs every week. Then there’s also a whole bunch of best practices and of course the vSphere Hardening Guide. As an administrator do you have time to read everything that is published every day? And then when you have read it, do you have time to check your environment if the issue or best practice described applies to your infrastructure? Of course you don’t, and this is where Runecast Analyzer comes in to play.

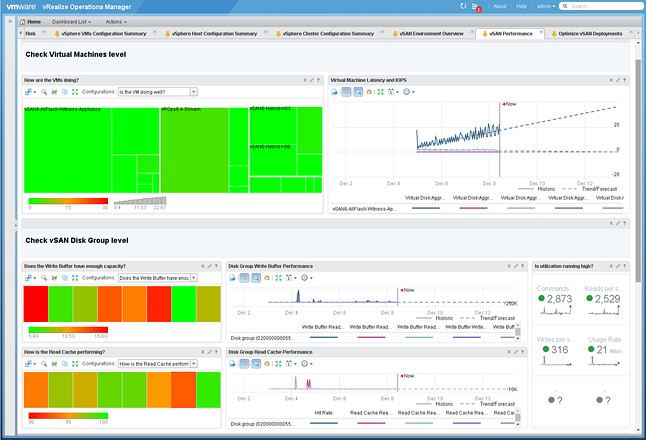
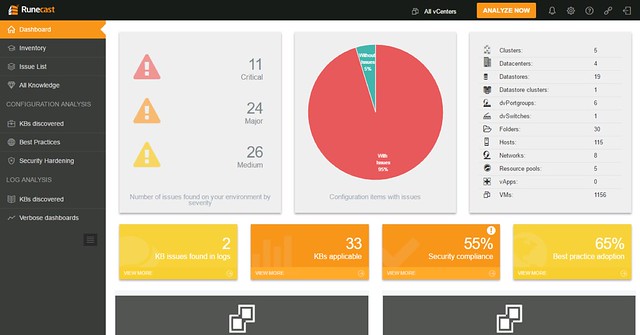
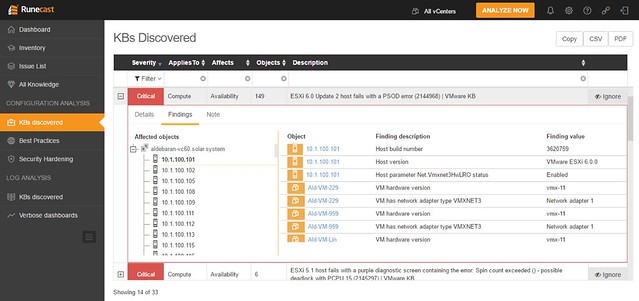
You download the appliance and provision it in to your environment, next you simply hook vCenter Server in to it and off you go. (As of 1.5 it also supports connecting several vCenter Server instances by the way.) Click analyze now and check the issues called out in the HTML-5 dashboard. As the screenshot below shows, this particular environment has issues identified in the log file that are described in a KB article. There are various other KB articles that may apply, just as an example: a combination of a certain virtual NIC with a specific OS may not be recommended. Also, various potential security issues and best practices are raised if they exist/apply.

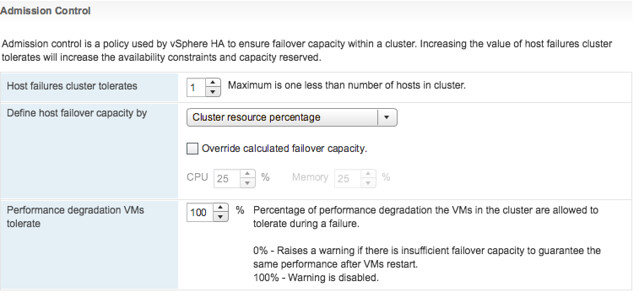
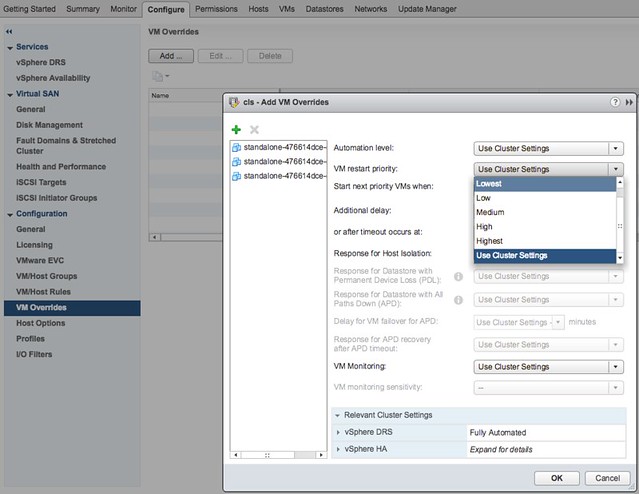
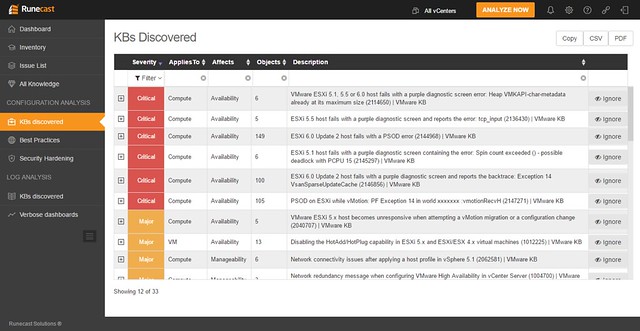
When you would click one of these areas you can drill down in to what the issue is and potentially figure out how to mitigate it. In the screenshot below you see the list of KBs that apply to this particular environment, you can open the particular entry (second screenshot below) and then find out to what it applies (objects: VMs, hosts, vCenter etc). If you feel it doesn’t apply to you, or you accept the risk, you can of course “ignore” the issue. When you click ignore a filter will be created which rules out this issue from being called out through the dashboard. The filtering mechanism is pretty smart, and you can easily create your own filters on any level of the virtual infra hierarchy. Yes, it is also possible to delete the filter(s) again when you feel it does apply to your environment.

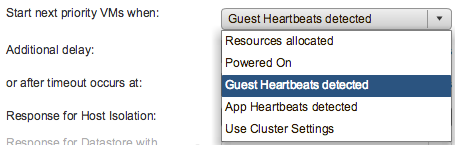
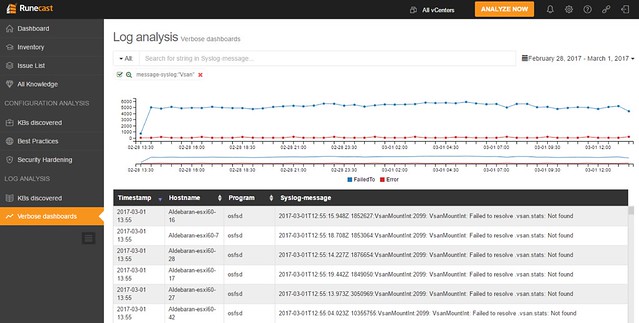
Besides checking the environment, as mentioned, Runecast can also analyze the logs for you. And I was happy to see that this got added, as it makes it unique compared to other solutions out there. Depending on what you are looking for you have these quick filtering options, and of course there are search strings and you can select a time period in which you would like to search of this particular string

As I said, all of this comes as a virtual appliance, which does not require direct connection to the internet. However, in order to keep the solution relevant you will need to update regularly, they mentioned they release a new data set once every two weeks roughly. It can be updated over the internet (through a proxy if needed), or you can download the ISO and update Runecast Analyzer through that, which could be very useful in secure locations. The appliance works against vSphere 5.x and 6.x (yes including 6.5) and there is a 30 day free trial. (Annual subscription, per socket pricing.) If you like to give it a try, click the banner on the right side, or go to their website: https://www.runecast.biz/. Pretty neat solution, and looking forward seeing what these guys can achieve with the funding they just received.

Cool tool update: RVTools 3.9.2

Duncan Epping · Mar 3, 2017 ·

It has been a year since version 3.8, but finally here it is… RVTools 3.9. Rob de Vey has been developing this tool since early 2008 and over 650k copies have been downloaded so far. I understand why, as it is a very easy to use tool that produces a lot of great information. On top of everything it was already providing, Rob introduced the following in version 3.9:

Version 3.9 (February, 2017)

  • Migrated RVTools to use .NET Framework version 4
  • Migrated RVTools to use NPOI 2.1.3.1
  • Support for vSphere 6.5
  • Improved logon performance
  • RVTools will no longer write messages to the Windows eventlog
  • All VM related tab pages now have a new column: OS according to the VMware Tools
  • All tab pages now have a new column: VI SDK Server
  • All tab pages column vCenter UUID renamed to VI SDK UUID
  • vInfo tab page: new column VI SDK API version
  • Export to Excel will now use xlsx format
  • Export to Excel all columns are now auto sized
  • Excel worksheet names will use same name as the tab page names
  • Annotations fields can now be excluded! See preference window
  • vPartition tab page new column: Consumed MB
  • vHealth _replica directories are excluded for zombie checks
  • sesparse.vmdk files are excluded for zombie checks
  • New tab page with license information
  • New PasswordEncryption application added with which you can encrypt your password
  • RVTools command line interface accepts now encrypted passwords
  • Bug fix: URL Link to online version info issue solved

New vSAN Management Pack for VROps

Duncan Epping · Dec 19, 2016 ·

I just wanted to add this pointer, if you are a vSAN and VROps customer then it is good to know that there is a new pack for vSAN. You need to be running vSAN 6.2 or 6.5 and VROps 6.4. It is a dedicated vSAN Management Pack by the way, which has as advantage for us (and you) that we will be able to iterate faster based on your needs.

You can find it here:  https://solutionexchange.vmware.com/store/products/vmware-vrealize-operations-management-pack-for-vsan

vSphere 6.5 what’s new – HA

Duncan Epping · Oct 19, 2016 ·

Here we go, one of my favourite features in vSphere… What’s new for HA in vSphere 6.5. To be honest, a lot! Many new features have been introduced, and although it took a while, I am honoured to say that many of these features are the results of discussions I had with the HA engineering team in the past. On top of that, your comments and feedback on some of my articles about HA futures have resulted in various changes to the design and implementation, my thanks for that! Before we get started, one thing I want to point out, in the Web Client under “Services” it now states “vSphere Availability” instead of HA, the reason for this is that because a new feature was stuck in to this section which is all about Availability but not implemented through HA.

  • Admission Control
  • Restart Priority enhancements
  • HA Orchestrated Restart
  • ProActive HA

Lets start with Admission Control first. This has been completely overhauled from a UI perspective, but essential still offers the same functionality but in an easy way and some extras. Let take a look at the UI first and then break it down.

In the above screenshot we see “Cluster Resource Percentage” while above that we have specified the “Host failures cluster tolerates” as “1”. What does this mean? Well this means that in a 4 host cluster we want to be capable of losing 1 host worth of resources which equals 25%. The big benefit of this is that when you add a host to the cluster, the amount of resources set aside will then be automatically changed to 20%. So if you scale up, or down, the percentage automatically adjusts based on the selected number of failures you want to tolerate. Very very useful if you ask me as you won’t end up wasting resources any longer simply because you forgot to change the percentage when scaling the cluster. And the best, this doesn’t use “slots” but is the old “percentage based” solution still. (You can manually select the slot policy under “Define host failover capacity by” though if you prefer that.

Second part of enhancements around Admission Control is the “VM resource reduction event threshold” section. This is a new section and this is based on the fling that was out there for a while. I am very proud to see this being released as it is a feature I was closely involved with and actually had two patents awarded for recently. What does it do? It allows you to specify the performance degradation you are willing to incur if a failure happens. It is set to 100% by default, but I can imagine you want to change this to for instance 25% or 50%, depending on your SLA with the business. Setting it is very simple, you just change the percentage and you are done. So how does this work? Well first of all, you need DRS enabled as HA leverages DRS to get the cluster resource usage. But lets look at an example:

75GB of memory available in 3 node cluster
1 host failure to tolerate specifed
60GB of memory actively used by VMs
0% resource reduction tolerated

This results in the following:
75GB – 25GB (1 host worth of memory) = 50GB
We have 60GB of memory used, with 0% resource reduction to tolerate
60GB needed, 50GB available after failure >> Warning issued to Admin

Very useful if you ask me, as finally you can guarantee that the performance for you workloads after a failure event is close or equal to the performance before a failure event! Next up, Restart Priority enhancements. We have had this option in the UI for the longest time. It allowed you to specify the startup priority for VMs and that is what HA used during scheduling, however the restarts would happen so fast that in reality no one really noticed the difference between high, medium or low priority. In fact, in many cases the small “low priority” VMs would be powered up long before the larger “high priority” database machines. With 6.5 we introduce some new functionality. Lets show you how this works:

Go to your vSphere HA cluster and click on the configure tab and then select VM Overrides, next click Add. You are presented with a screen where you can select VMs by clicking the green plus and then specify their relative startup priority. I selected 3 VMs and then pick “lowest”, the other options are “low, medium, high and highest”. Yes the names are a bit funny, but this is to ensure backwards compatibility with the previous priority options.

After you have specified the priority you can also specify if there needs to be an additional delay before the next batch can be started, or you can specify even what triggers the next priority “group”, this could for instance be the VMware Tools guest heartbeat as shown in the screenshot below. The other option is “resources allocated” which is purely the scheduling of the batch itself, the power-on event completion or the “app heartbeat” detection. That last one is most definitely the most complex as you would need to have App HA enabled and services defined etc. I expect that if people use this they will mostly set it to “Guest Heartbeats detected” as that is easy and pretty reliable.

If for whatever reason by the way there is no guest heartbeat ever, or it simply takes a long time then there is also a timeout value that can be specified. By default this is 600 seconds, but this can be decreased or increased, depending on what you prefer. Now this functionality is primarily intended for large groups of VMs, so if you have a 1000 VMs you can select those 10/20 VMs that have the highest priority and let them power-on first. However, if you for instance have a 3-tier app and you need the database server to be powered on before the app server then you can also use VM/VM rules as of vSphere 6.5, this functionality is referred to as HA Orchestrated Restart.

You can configure HA Orchestrated Restarts by simply creating “VM” Groups. In the example below I have created a VM group called App with the Application VM in there. I have also created a DB group with the Database VM in there.

This application has a dependency on the Database VM to be fully powered-on, so I specify this in a rule as shown in the below screenshot.

Now one thing to note here is that in terms of dependency, the next group of VMs in the rule will be powered on when the cluster wide set “VM Dependency Restart Condition” is met. If this is set to “Resources Allocated”, which is the default, then the VMs will be restarted literally a split second later. So you will need to think about how to set the “VM Dependency Restart Condition” as other wise the rule may be useless. Another thing is that these rules are “hard rules”, so if the DB VM in this example does not power on, then the App VM will also not be powered on. Yes, I know what you would like to see, and yes we are planning more enhancements in this space.

Last up “Pro-Active HA“… Now this is the odd one, it is not actually a vSphere HA feature, but rather a function of DRS. However, as it is stuck in the “Availability” section of the UI I figured I would stick it in this article as that is probably where most people will be looking. So what does it do? Well in short, it allows you to configure actions for events that may lead to VM downtime. What does that mean? Well you can imagine that when a power-supply goes down your host is in a so called “degraded state”, when this event occurs an evacuation of the host could be triggered, meaning all VMs will be migrated to any of the remaining healthy hosts in the cluster.

But how do we know the host is in a degraded state? Well that is where the Health Provider comes in to play. The health provider reads all the sensor data and analyze the results and then serve the state of the host up to vCenter Server. These states are “Healthy”, “Moderate Degration”, “Severe Degradation” and “Unknown”. (Green, Yellow, Red) When vCenter is informed DRS can now take action based on the state of the hosts in a cluster, but also when placing new VMs it can take the state of a host in to consideration. The actions DRS can take by the way is placing the host in Maintenance Mode or Quarantine Mode. So what is this quarantine mode and what is the difference between Quarantine Mode and Maintenance Mode?

Maintenance Mode is very straight forward, all VMs will be migrated off the host. With Quarantine Mode this is not guaranteed. If for instance the cluster is overcommitted then it could be that some VMs are left on the quarantined host. Also, when you have VM-VM rules or VM/Host rules which would conflict when the VM is migrated then the VM is not migrated either. Note that quarantined hosts are not considered for placement of new VMs. It is up to you to decide how strict you want to be, and this can simply be configured in the UI. Personally I would recommend setting it to Automated with “Quarantine mode for moderate and Maintenance mode for sever failure(Mixed)”. This seems to be a good balance between up time and resource availability. Screenshot below shows where this can be configured.

Pro-Active HA can respond to different types of failures, at the start of this section I mentioned power supply, but it can also respond to memory, network, storage and even a fan failure. Which state this results in (severe or moderate) is up to the vendor, this logic is built in to the Health Provider itself. You can imagine that when you have 8 fans in a server that the failure of one or two fans results in “moderate”, whereas the failure of for instance 1 out of 2 NICs would result in “severe” as this leaves a “single point of failure”. Oh and when it comes to the Health Provider, this comes with the vendor Web Client plugins.

vSphere 6.5 what’s new – DRS

Duncan Epping · Oct 19, 2016 ·

Most of us have been using DRS for the longest time. To be honest, not much has changed over the past years, sure there were some tweaks and minor changes but nothing huge. In 6.5 however there is a big feature introduced, but lets just list them all for completeness sake:

  • Predictive DRS
  • Network-Aware DRS enhancements
  • DRS profiles

First of all Predictive DRS. This is a feature that the DRS team has been working on for a while. It is a feature that integrates DRS with VROps to provide placement and balancing decisions. Note that this feature will be in Tech Preview until vRealize Operations releases their version of vROPs which will be fully compatible with vSphere 6.5, hopefully sometime in the first half of next year. Brian Graf has some additional details around this feature here by the way.

Note that of course DRS will continue to use the data provided by vCenter Server, it will on top of that however also leverage VROps to predict what resource usage will look like, all of this based on historic data. You can imagine a VM currently using 4GB of memory (demand), however every day around the same time a SQL Job runs which makes the memory demand spike up to 8GB. This data is available through VROps now and as such when making placement/balancing recommendations this predicted resource spike can now be taken in to consideration. If for whatever reason however the prediction is that the resource consumption will be lower then DRS will ignore the prediction and simply take current resource usage in to account, just to be safe. (Which makes sense if you ask me.) Oh and before I forget, DRS will look ahead for 60 minutes (3600 seconds).

How do you configure this? Well that is fairly straight forward when you have VROps running, go to your DRS cluster and click edit settings and enable the “Predictive DRS” option. Easy right? (See screenshot below) You can also change that look ahead value by the way, I wouldn’t recommend it though but if you like you can add an advanced setting called ProactiveDrsLookaheadIntervalSecs.

One of the other features that people have asked about is the consideration of additional metrics during placement/load balancing. This is what Network-Aware DRS brings. Within Network IO Control (v3) it is possible to set a reservation for a VM in terms of network bandwidth and have DRS consider this. This was introduced in vSphere 6.0 and now with 6.5 has been improved. With 6.5 DRS also takes physical NIC utilization in to consideration, when a host has higher than 80% network utilization it will consider this host to be saturated and not consider placing new VMs.

And lastly, DRS Profiles. So what are these? In the past we’ve seen many new advanced settings introduced which allowed you to tweak the way DRS balanced your cluster. In 6.5 several additional options have been added to the UI to make it easier for you to tweak DRS balancing, if and when needed that is as I would expect that for the majority of DRS users this would not be the case. Lets look at each of the new options:

So there are 3 options here:

  • VM Distribution
  • Memory Metric for Load Balancing
  • CPU Over-Commitment

If you look at the description then I think they make a lot of sense. Especially the first two options are options I get asked about every once in a while. Some people prefer to have a more equally balanced cluster in terms of number of VMs per host, which can be done by enable “VM Distribution”. And for those who much rather load balance on “consumed” vs “active” memory you can also enable this. Now the “consumed” vs “active” is almost a religious debate, personally I don’t see too much value, especially not in a world where memory pages are zeroed when a VM boots and consumed is always high for all VMs, but nevertheless if you prefer you can balance on consumed instead. Last is the CPU Over-Commitment, this is one that could be useful when you want to limit the number of vCPUs per pCPU, apparently this is something that many VDI customers have asked for.

I hope that was useful, we are aiming to update the vSphere Clustering Deepdive at some point as well to include some of these details…

  • « Go to Previous Page
  • Page 1
  • Page 2
  • Page 3
  • Page 4
  • Page 5
  • Page 6
  • Interim pages omitted …
  • Page 44
  • Go to Next Page »

Primary Sidebar

About the Author

Duncan Epping is a Chief Technologist and Distinguished Engineering Architect at Broadcom. Besides writing on Yellow-Bricks, Duncan is the co-author of the vSAN Deep Dive and the vSphere Clustering Deep Dive book series. Duncan is also the host of the Unexplored Territory Podcast.

Follow Us

  • X
  • Spotify
  • RSS Feed
  • LinkedIn

Recommended Book(s)

Advertisements


Copyright Yellow-Bricks.com © 2025 · Log in