My ESXTOP page is still one of the most visited pages I have, it actually comes in on a second spot just right after the HA Deepdive. Every once in a while I revise the page and this week it was time to add VisualEsxtop to the list of tools people should use. I figured I would write a regular blog post first and roll it up in to the page at the same time. So what is VisualEsxtop?
VisualEsxtop is an enhanced version of resxtop and esxtop. VisualEsxtop can connect to VMware vCenter Server or ESX hosts, and display ESX server stats with a better user interface and more advanced features.
That sounds nice right? Lets have a look how it works, this is what I did to get it up and running:
- Go to “http://labs.vmware.com/flings/visualesxtop” and click “download”
- Unzip “VisualEsxtop.zip” in to a folder you want to store the tool
- Go to the folder
- Double click “visualesxtop.bat” when running Windows (Or follow William’s tip for the Mac)
- Click “File” and “Connect to Live Server”
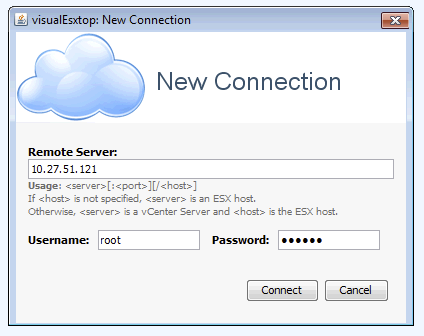
- Enter the “Hostname”, “Username” and “Password” and hit “Connect”

- That is it…
Now some simple tips:
- By default the refresh interval is set to 5 seconds. You can change this by hitting “Configuration” and then “Change Interval”
- You can also load Batch Output, this might come in handy when you are a consultant for instance and a customers sends you captured data, you can do this under: File -> Load Batch Output
- You can filter output, very useful if you are looking for info on a specific virtual machine / world! See the filter section.

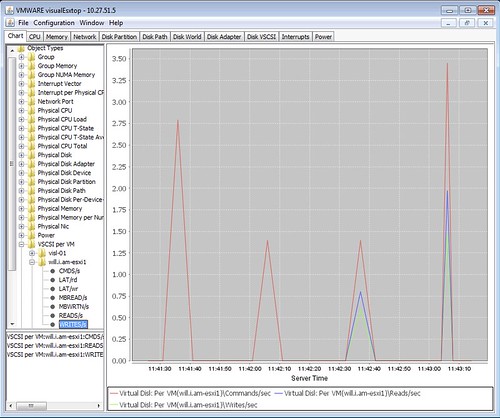
- When you click “Charts” and double click “Object Types” you will see a list of metrics that you can create a chart with. Just unfold the ones you need and double click them to add them to the right pane

There are a bunch of other cool features in their like color-coding of important metrics for instance. Also the fact that you can show multiple windows at the same time is useful if you ask me and of course the tooltips that provide a description of the counter! If you ask me, a tool everyone should download and check out.
If you have feedback, make sure to leave a comment on the flings site as the engineers of this tool will be tracking that to see where improvements can be made.
Interesting tool, thanks!
Cool Tool so far !!
I can’t figure out how to connect to a vCenter Server – any ideas? I can connect to my hosts just fine, though. Cool tool!
GOOD STUFFS. but i keep receiving error the Java not recognized and i have added into the path variable..but still persists.. any idea?
Try adding this to the begining of the batch file. you may need to change the JRE version and location.
set path= C:\Program Files (x86)\Java;C:\Program Files (x86)\Java\jre7;C:\Program Files (x86)\Java\jre7
\bin;%path%
Very Nice ! Thanks
Nice
I am trying to find out the CPU utilization for a particular VM. How do I see the CPU utilization rates per VM?
very nice tool, tanks.
Really cool
I have the path set
set path= C:\Program Files\Java\jre1.6.0_05\bin;%path%
and the program keep frozen….any idea ???
keeps crashing after 30 seconds
Hi Duncan,
I can use it to connect to ESXi version 5.1, but cannot connect to ESXi verstion 5.5. Does this verstion of VisualEsxtop NOT support vSphere 5.5?
Is there any upgraded version of VisualEsxtop?
Haven’t used it for a while to be honest… don’t know. I haven’t seen an update internally even, will ask around for you!
Hi,
Is this sure that “visual esxtop” is not working on vCenter 5.5 and esxi 5.5?
At least I can’t connect to esxi5.5. When I connect to esxi5.1, it can connect very fast and successfully.
But when connecting to esxi5.5, it show an error:”Connection failed:/ by zero”