• Skip to primary navigation
  • Skip to main content
  • Skip to primary sidebar

Yellow Bricks

by Duncan Epping

  • Home
  • Unexplored Territory Podcast
  • HA Deepdive
  • ESXTOP
  • Stickers/Shirts
  • Privacy Policy
  • About
  • Show Search
Hide Search

troubleshooting

vShield App broke down on the host that is running vCenter now what?

Duncan Epping · Nov 15, 2011 ·

I was playing around with vShield App and I locked out my vCenter VM which happened to be hosted on the cluster which was protected by vShield App. Yes I know that it is not recommended, but I have a limited amount of compute resources in my lab and I can’t spare a full server just for vCenter so I figured I would try it anyway and by breaking stuff I learn a lot more.

I wanted to know what happened when my vShield App virtual machine would fail. So I killed it and of course I couldn’t reach vCenter anymore. The reason for this being is the fact that a so-called dvfilter is used. The dvfilter basically captures the traffic, sends it to the vShield App VM which inspects it and then sends it to the VM (or not depending on the rules). As I killed my vShield App VM there was no way it would work. If I would have had my vCenter available I would just vMotion the VMs to another host and the problem would be solved, but it was my vCenter which was impacted by this issue. Before I started digging myself I did a quick google and I noticed this post by vTexan. He had locked himself out by creating strict rules, but my scenario was different. What were my options?

Well there are multiple options of course:

  1. Move the VM to an unprotected host
  2. Disarm the VM
  3. Uninstall vShield

As I did not have an unprotected host in my cluster and did not want to uninstall vShield I had only 1 option left. I figured it couldn’t be too difficult and it actually wasn’t:

  1. Connect your vSphere Client to the ESXi host which is running vCenter
  2. Power Off the vCenter VM
  3. Right click the vCenter VM and go to “Edit Settings”
  4. Go to the Options tab and click General under Advanced
  5. Click Configuration Parameters
  6. Look for the “ethernet0.filter0” entries and remove both values
  7. Click Ok, Ok and power on your vCenter VM

As soon as your vCenter VM is booted you should have access to vCenter again. Isn’t that cool? What would happen if your vShield App would return? Would this vCenter VM be left unprotected? No it wouldn’t, vShield App would actually notice it is not protected and add the correct filter details again so that the vCenter VM will be protected. If you want to speed this process up you could of course also vMotion the VM to a host which is protected. Now keep in mind that while you do the vMotion it will insert the filter again which could cause the vCenter VM to disconnect. In all my tests so far it would reconnect at some point, but that is no guarantee of course.

Tomorrow I am going to apply a security policy which will lock out my vCenter Server and try to recover from that… I’ll keep you posted.

** Disclaimer: This is for educational purposes, please don’t try this at home… **
Repeated characters when typing in your VMs remote console?

Duncan Epping · Nov 14, 2011 ·

Today I was working on a couple of test scenarios in a remote lab. For some reason the latency was a lot higher than normal and I was very difficult to type anything in the Remote Console through the vCenter Client. Every single character I tried popped up 2 or 3 times… which makes it very difficult to type a password as you can imagine. I knew I read a KB article about this exact problem a long time ago. Considering it is KB 196 I probably wasn’t the first to bump in to this. The solution is fairly simple:

  • Power off the VM
  • Edit Settings
  • Click the Options Tab
  • Click “General”
  • Click “Configuration Parameters”
  • Click “Add Row”
  • Enter the name: keyboard.typematicMinDelay
  • Enter the value: 2000000

Although the KB article doesn’t mention it, this also applies to vSphere 5.0.

How cool is TPS?

Duncan Epping · Jan 10, 2011 ·

Frank and I have discussed this topic multiple times and it was briefly mentioned in Frank’s excellent series about over-sizing virtual machines; Zero Pages, TPS and the impact of a boot-storm. Pre-vSphere 4.1 we have seen it all happen, a host fails and multiple VMs need to be restarted. Temporary contention exists as it could take up to 60 minutes before TPS completes. Or of course when the memory pressure thresholds are reached the VMkernel requests TPS to scan memory and collapse pages if and where possible. However, this is usually already too late resulting in ballooning or compressing (if your lucky) and ultimately swapping. If it is an HA initiated “boot-storm” or for instance you VDI users all powering up those desktops at the same time, the impact is the same.

Now one of the other things I also wanted to touch on was Large Pages, as this is the main argument our competitors are using against TPS. Reason for this being that Large Pages are not TPS’ed as I have discussed in this article and many articles before that one. I even heard people saying that TPS should be disabled as most Guest OS’es being installed today are 64Bit and as such ESX(i) will back even Small Pages (Guest OS) by Large Pages and TPS will only add unnecessary overhead without any benefits… Well I have a different opinion about that and will show you with a couple of examples why TPS should be enabled.

One of the major improvements in vSphere 4.0 is that it recognizes zeroed pages instantly and collapses them. I have dug around for detailed info but the best I could publicly find about it was in the esxtop bible and I quote:

A zero page is simply the memory page that is all zeros. If a zero guest physical page is detected by VMKernel page sharing module, this page will be backed by the same machine page on each NUMA node. Note that “ZERO” is included in “SHRD”.

(Please note that this metric was added in vSphere 4.1)

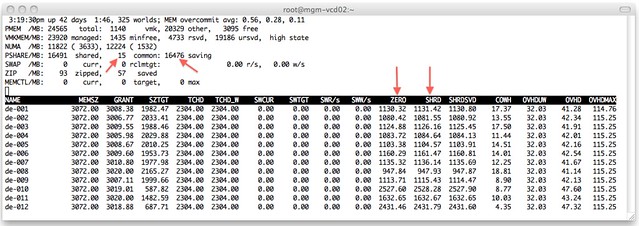
I wondered what that would look like in real life. I isolated one of my ESXi host (24GB of memory) in my lab and deployed 12 VMs with 3GB each with Windows 2008 64-Bit installed. I booted all of them up in literally seconds and as Windows 2008 zeroes out memory during boot I knew what to expect:

I added a couple of arrows so that it is a bit more obvious what I am trying to show here. On the top left you can see that TPS saved 16476MB and used 15MB to store unique pages. As the VMs clearly show most of those savings are from “ZERO” pages. Just subtract ZERO from SHRD (Shared Pages) and you will see what I mean. Pre-vSphere 4.0 this would have resulted in severe memory contention and as a result more than likely ballooning (if the balloon driver is already started, remember it is a “boot-storm”) or swapping.

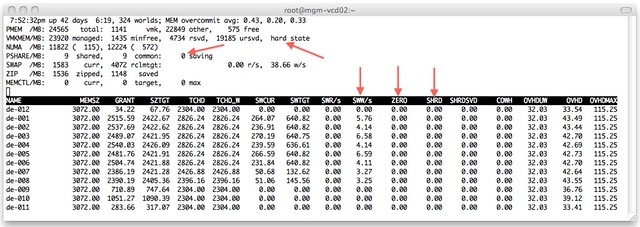
Just to make sure I’m not rambling I disabled TPS (by setting Mem.ShareScanGHz to 0) and booted up those 12 VMs again. This is the result:

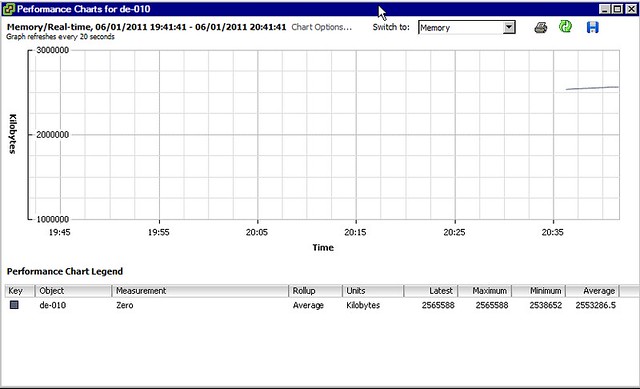
As shown at the top, the hosts status is “hard” as a result of 0 page sharing and even worse, as can be seen on a VM level, most VMs started swapping. We are talking about VMkernel swap here, not ballooning. I guess that clearly shows why TPS needs to be enabled and where and when you will benefit from it. Please note that you can also see “ZERO” pages in vCenter as shown in the screenshot below.

One thing Frank and I discussed a while back, and I finally managed to figure out, is why after boot of a Windows VM the “ZERO” pages still go up and fluctuate so much. I did not know this but found the following explanation:

There are two threads that are specifically responsible for moving threads from one list to another. Firstly, the zero page thread runs at the lowest priority and is responsible for zeroing out free pages before moving them to the zeroed page list.

In other words, when an application / service or even Windows itself “deprecates” the page it will be zeroed out by the “zero page thread” aka garbage collector at some point. The Page Sharing module will pick this up and collapse the page instantly.

I guess there is only one thing left to say, how cool is TPS?!

Binding a vCloud Director Provider vDC to an ESX Host?

Duncan Epping · Dec 27, 2010 ·

One of our partners was playing around with vCloud Director and noticed that they could create a Provider vDC and link it directly to an ESX Host. vCloud Director did not complain about it so they figured it would be okay. However it is a requirement for vCloud Director to have DRS. One of the reasons for this being is the fact that vCloud Director leverages resource pools to ensure tenants receive what they are entitled to.

But back to the issue, they created the Provider vDC and went on to create an Org vDC and even that worked fine… Next stop was the “Organization Network. In order to create one you will need to select a network pool at some point and for some weird reason that didn’t work. After some initial emailing back and forth I noticed they didn’t select a cluster or resource pool but an ESX host. After creating a new Provider vDC based on a vSphere Resource Pool all of a sudden everything started working. Although I cannot really say why it is exactly this part that causes an issue, I can tell you that DRS is a hard requirement and not just  a suggestion!

Using opvizor

Duncan Epping · Dec 9, 2010 ·

I introduced Opvizor a couple of days ago and figured why not give it a spin with a vm-support files of one of my hosts in my lab. I used vCenter to create the vm-support file, for those who have never done that it is really simple:

  • open the vSphere Client
  • Click Administration
  • Click “Export System Logs”
  • Select the server of which you want to dump the system logs and select the location where they need to be uploaded to

The next thing you will need to do is create an account on the opvizor website and login. After that you can simply upload the System Log File of the server. After uploading it takes a few seconds before the System Logs are processed but you can actually see the status at the lower right by clicking the icon. After uploading you can use one of the following two options:

  • isLogViewer
  • isClient

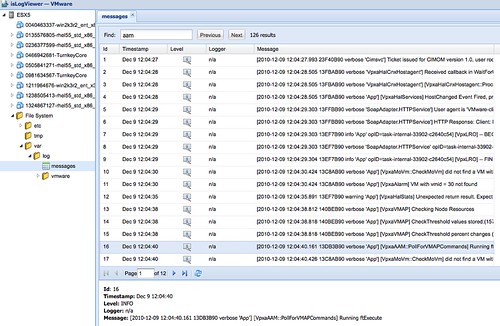
I guess it is pretty obvious what isLogViewer does. It enables you to view the logfiles of VMs and your Host. But not only logfiles, you can for instance also see the vmdk meta files and your vmx files. This can come in handy when troubleshooting issues and I can imagine that at some point opvizor will warn you when invalid or insecure settings / statements are used in those files. The isLogViewer also enables you to search logfiles as shown in the following screenshot where I did a search on “aam”.

Although it isn’t completely intuitive yet; it definitely has potential. Couple of things I would like to see added:

  • color coding for error types
  • direct linking to KB articles for known error codes

The second feature that is currently offered is “isClient”. This feature currently shows you more details about for instance the VM configuration and the host configuration. For me the most valuable feature here is “Issues”. Clearly it still needs to be expanded as many sections are not available, but again this has a lot of potential as you can see in the screenshot below:

Again I would like to see things like color coding added and possibly links to KBs and for instance references to best practices and recommendations. Think about things like Network redundancy, Storage PSP used, HCL check… you can go anyway with this and this could be the ultimate troubleshooting / health check tool. If all of this is added and if it is possible to upload support files of a full environment instead of just a single host.

All in all, I realize that opvizor is just in an early beta phase and because of that some features aren’t fully implemented yet. It clearly has a lot potential though and if everyone takes the time to check it out and give feedback I think this can become a killer tool.

  • « Go to Previous Page
  • Page 1
  • Page 2
  • Page 3
  • Page 4
  • Go to Next Page »

Primary Sidebar

About the Author

Duncan Epping is a Chief Technologist and Distinguished Engineering Architect at Broadcom. Besides writing on Yellow-Bricks, Duncan is the co-author of the vSAN Deep Dive and the vSphere Clustering Deep Dive book series. Duncan is also the host of the Unexplored Territory Podcast.

Follow Us

  • X
  • Spotify
  • RSS Feed
  • LinkedIn

Recommended Book(s)

Advertisements


Copyright Yellow-Bricks.com © 2025 · Log in