• Skip to primary navigation
  • Skip to main content
  • Skip to primary sidebar

Yellow Bricks

by Duncan Epping

  • Home
  • Unexplored Territory Podcast
  • HA Deepdive
  • ESXTOP
  • Stickers/Shirts
  • Privacy Policy
  • About
  • Show Search
Hide Search

startup

Startup intro: SaaS-based backup solution Clumio

Duncan Epping · Apr 6, 2020 ·

Last week I saw an update from one of the Clumio founders on twitter. It reminded me that I had promised to take a look at their product. This week I had a meeting set up with Clumio and we went over their product and how to configure it briefly. Clumio is a SaaS based backup solution that was founded in 2017 by former PernixData, Nutanix, EMC folks. The three founders are Poojan Kumar, Kaustubh Patil, and Woon Jung, and those three you may remember from PernixData. One thing to point out is that they had 3 rounds of funding (~190 million dollars) so far and they came out of stealth around VMworld 2019. Coincidentally they won the Gold award for Best of VMworld in the data protection category, and best of show for the entire show, not bad for a first VMworld. I guess that I have to point out that although I would classify them as backup/recovery today, they are adding new functionality weekly and “backup/recovery” is probably not a fair category, data protection is more appropriate and it would not surprise me if that evolves to data management and protection over time. If you are not a fan of reading, simply head over to my youtube video on Clumio, otherwise, just continue below.

So how does it work conceptually? Well they basically have a SaaS solution, but you will need to install an OVA (they call it a cloud connector) in your environment to connect to the SaaS platform for VMware on-premises and VMware Cloud on AWS. When you connect AWS EBS they use a cloud formation template. This cloud connector is a 4 vCPU/8GB virtual machine that then needs the ability to connect to “the outside world” of course. The Cloud Connector is stateless and requires no updates. You can run this Cloud Connector appliance in multiple clusters, on-prem, or in VMware Cloud on AWS and once they are registered you will see those data sources in your portal.  This is nice as you can see all your data sources across public and private clouds in one single pane of glass. You will have the ability to define “backup schemes” by creating policies. These policies can of course then be associated with objects. These objects can be VMs, Clusters and even vCenter Server instances. This means that if you assign a policy to vCenter Server that every new VM created will inherit the policy automatically. You may wonder, where is your data stored? Your data is stored in S3 buckets that are part of the Clumio SaaS-based platform. Customers are isolated from each other, they will have their own dedicated S3 buckets, and these buckets are created and maintained by Clumio, you as a customer only interact with Clumio! [Read more…] about Startup intro: SaaS-based backup solution Clumio

Runecast Analyzer 3.0!

Duncan Epping · Aug 21, 2019 ·

This week I had a brief conversation with the folks from Runecast. I have been following them since day 1 and they have made a big impression on me from the start. During the conversation the Runecast folks shared with me that Runecast Analyzer 3.0 was going to be announced today and they gave a quick overview and demo of what would be announced and included in 3.0. They also quickly went over the functionality that was added the past year, some things which really were well adopted by customers were HIPAA and DISA-STIG compliance feature. Also Horizon support and security auto-remediation capabilities. Another thing that customers really appreciated were the upgradability simulations (beta feature), where Runecast validates your environment against the HCL.

Stan (Runecast CEO) also mentioned that this year Runecast signed up a customer with over 10k hosts, as you can imagine a lot of the work in the past 12 months was focused on scalability and performance at that level of scale. But that is not what today’s announcement is about, today Runecast is announcing 3.0. In 3.0 there are some great enhancements to the platform again. First of all, production-ready HCL Analysis for vSphere and vSAN. On top of that, the ESXi Upgrade Simulation is now GA, and the log analysis has been improved. Runecast is also introducing a new H5 Client plugin-in with new widgets and a dark theme! Just look at it below, you have got to love the dark theme!

But as I mentioned, there’s more to it than just the H5 Client Plugin, the HCL Analysis and the Upgrade Simulation are two key features if you ask me. During the demo, Stan showed me the below screen, and I think that by itself makes it worth testing out Runecast. It simply shows you in one overview if your environment is compliant to the HCL or not, and if it is not compliant, which combination of firmware and driver you should be using to make it compliant. In this example, the driver should be upgraded to 2.0.42. A very useful feature if you ask me. Note that this will work for both vSphere and vSAN and all components needed to run either of these.

Just as useful is the Upgrade Simulation by the way, are you considering upgrading? Make sure to run this first so you know if you will end up in a supported state or not?! And some of you may say that VMware has similar capabilities in their product, but the Runecast appliance doesn’t need to be connected to the internet at all times. You can regularly update the dataset and run these compliancy and upgrade checks (or any of the other checks) regularly offline. Especially for customers where internet access is challenging (dark sites) this is very helpful.

All in all, some very useful updates to an already very useful solution.

Startup update: Runecast 2.0

Duncan Epping · Aug 21, 2018 ·

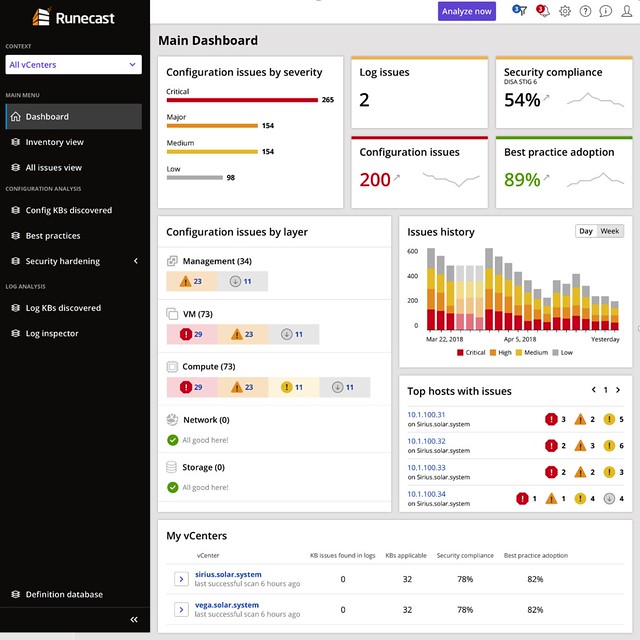
Last week I was briefed by Runecast (together with Cormac) on the new version, Runecast 2.0, which was released/announced today. I always enjoy talking to Stan as every time we talk they have something new which surprises me, or he tells me about something cool on the roadmap. For those who did not read my previous articles, Runecast is a company which focusses on analyzing VMware environments and assess the environment on potential issues. These issues could be anything ranging from configuration issues, driver/firmware issue, to security issues. It reminds me very much of what we have with vSAN which is the health check. The big difference though is that this solution includes many more checks and doesn’t just focus on vSAN but on many different parts of the stack. Just to give you an idea, today Runecast can analyze your vSphere environment up to vSphere 6.7 and can also analyze vSAN and NSX-V. The cool thing is that it also does this “offline”, they have an appliance and regular updates (rules and features) and this means that even in a dark site this would work.

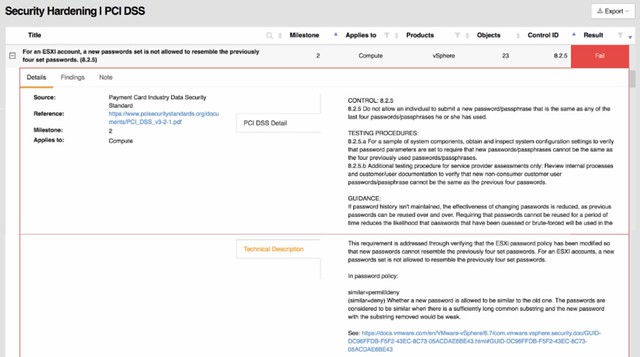
A lot of Runecast’s customers are either in the financial space or government space. I guess this is also why their focus for the 2.0 version was primarily on PCI-DSS. With over 200 technical checks, which map against PCI-DSS requirements, they (as Runecast told me) have by far the largest collection of requirements in an automated analyzer (for VMware) in the industry. Definitely, a smart enhancement, if you are not interested in PCI-DSS, you can simply disable the whole check and it will never show up in your interface. You can also, if only a limited number of clusters should be validated, filter out certain results.

The 20 version of Runecast also comes with a lot of updates around the appliance, now I consider these “internals” as for most customers it is not relevant in terms of the value it offers, but it is important to know from a security perspective I guess.

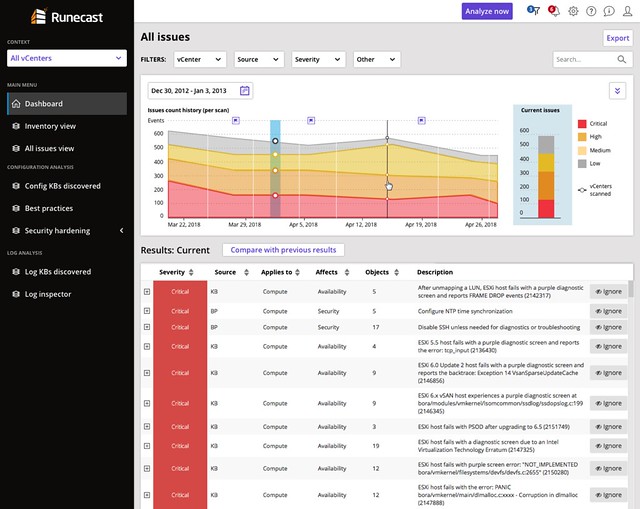
This version also introduces a historical perspective. Meaning that starting with Runecast 2.0 the historical information of checks is stored. This will allow you to see some form of trending when it comes to the different checks/validations. You could for instance now track if you do updates and maintenance if the number of potential issues is going down. You could also task someone with validating the reported issues and fixing those when or where possible. This should over time improve the availability, reliability, and security of your environment.

Last but not least the UI has been fully overhauled. They redesigned it just to make it easier to read and understand. Also, a couple of dashboards were added, which makes sense… a new release means new dashboards!

If you happen to go to VMworld, make sure to stop by their booth and have a look, I think you will find it interesting. Or simply read the Runecast blog, and download the appliance and try it out.

Opvizor Performance Analyzer for vSAN

Duncan Epping · Jul 10, 2018 ·

At a VMUG a couple of months ago I bumped into my old friend Dennis Zimmer. Dennis told me that he was working on something cool for vSAN but couldn’t reveal what it was just yet. Last week I had a call with Dennis about what that thing was. Dennis is the CEO for Opvizor, and some of you may recall the different tooling that Opvizor has produced over the years, of which the Health Analyzer was probably the most famous one back then. I’ve used it in the past on various occasions and I had various customers using it. During the briefing, Dennis explained to me that Opvizor started focussing on performance monitoring and analytics a while ago as the health analyzer market was overly crowded and had the issue that is was a one-off business (checks once in a while instead of daily use). On top of that, many products now come with some form of health analysis included. (See vSAN for instance.) I have to agree with Dennis, so this pivot towards Performance Monitoring makes much sense to me.

Dennis explained to me how they are seeing more and more customer demand for vSAN performance monitoring especially combined with VMware ESXi, VM and App data. Although vCenter has various metrics, and there’s VROps, he told me that Opvizor has many customers who need more than vCenter or vROPS standard has to offer today and don’t own VROps advanced. This is where Opvizor Performance Analyzer comes in to play and that is why today Opvizor announced they are including vSAN specific dashboards. Now, this isn’t just for vSAN of course. Opvizor Performance Analyzer includes not just vSAN but also vSphere and various other parts of the stack. When talking with Dennis one thing became clear, Opvizor is taking a different approach than most other solutions. Where most focus on simplifying, hiding, and aggregating, the focus for Opvizor is on providing as much relevant detail as possible to fulfill the needs of beginner and professional.

So how does it work? Opvizor provides a virtual appliance. You simply deploy it in your environment and connect it to vCenter and you are ready to go. The appliance collects data every 5 minutes (but 20 seconds intervals of these 5 minutes) and has a retention of up to 5 years. As I said, the focus is on infrastructure statistics and performance analytics and as such Opvizor delivers all the data you ever need.

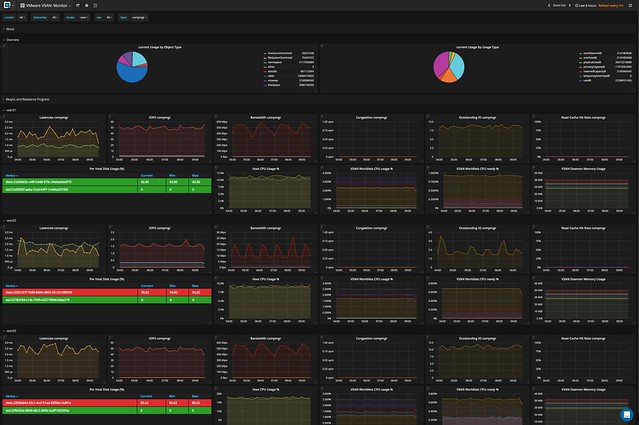
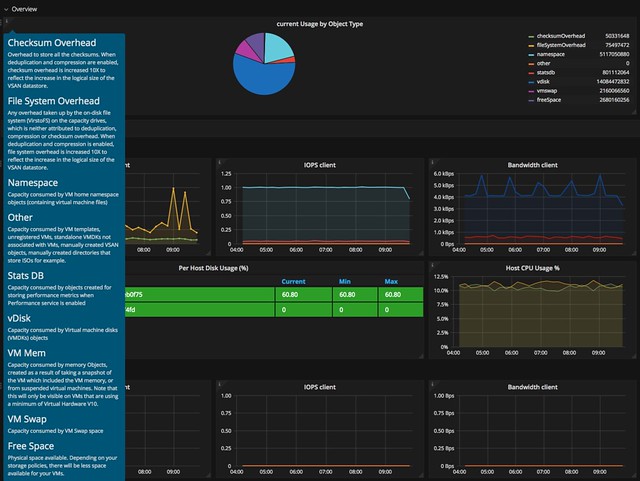
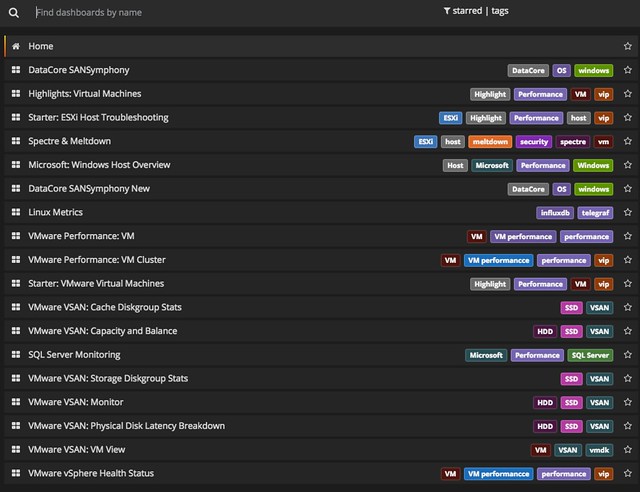
It doesn’t just provide you with all the info you will ever need. It will also allow you to overlay different metrics, which makes performance troubleshooting a lot easier, and will allow you to correlate and pinpoint particular problems. Opvizor comes with dashboards for various aspects, here are the ones included in the upcoming release for vSAN:

  • Capacity and Balance
  • Storage Diskgroup Stats
  • VM View
  • Physical disk latency breakdown
  • Cache Diskgroup stats
  • vSAN Monitor

Now I said this is the expert´s troubleshooting tool, but Opvizor Performance Analyzer also provided in-depth information about what each metric is / means and provides starter dashboards for beginners. You can simply click on the “i” in the top left corner of the widget and you get all the info about that particular widget.

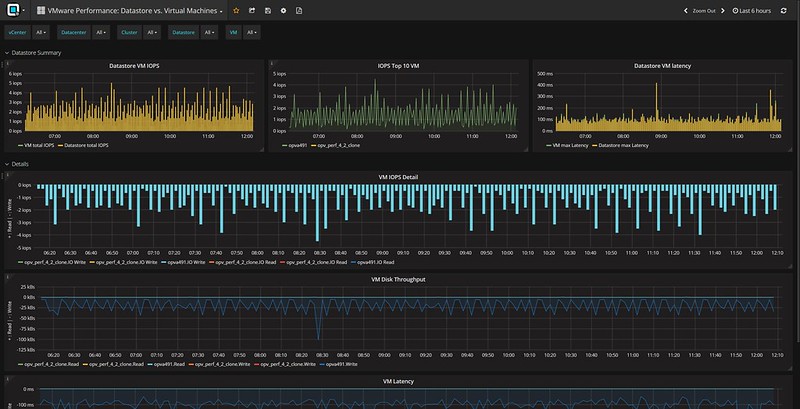
When you do know what you are looking for you can click, hover, and zoom when needed. Hover over the specific section in the graph and the point in time values of the metrics will pop up. In the case below I was drilling down on a VM in the vSAN cluster and looking at write latency in specific. As you can see we have 3 objects and in particular 2 disks and a “vm name space”.

And this is just a random example, there are many metrics to look at and many different widgets and overviews. Just to give you an idea, here are some of the metrics you can find in the UI:

  • Latency (for all different components of the stack)
  • IOPs (for all different components of the stack)
  • Bandwidth (for all different components of the stack)
  • Congestion (for all different components of the stack)
  • Outstanding I/O (for all different components of the stack)
  • Read Cache Hit rate (for all different components of the stack)\
  • ESXi vSAN host disk usage
  • ESXi vSAN host cpu usage
  • Number of Components
  • Disk Usage
  • Cache Usage

And there;s much more, too many to list in this blog. And again, not just vSAN, but there are many dashboards to chose from. If you don’t have a performance monitoring solution yet and you are evaluating solutions like SolarWinds, Turbunomics and others make sure to add Opvizor to that list. One thing I have to say, I spotted a couple of things that I liked to see changed, and I think within 24hrs the Opvizor guys managed to incorporate the feedback. That was a crazy fast turnaround, good to see how receptive they are.

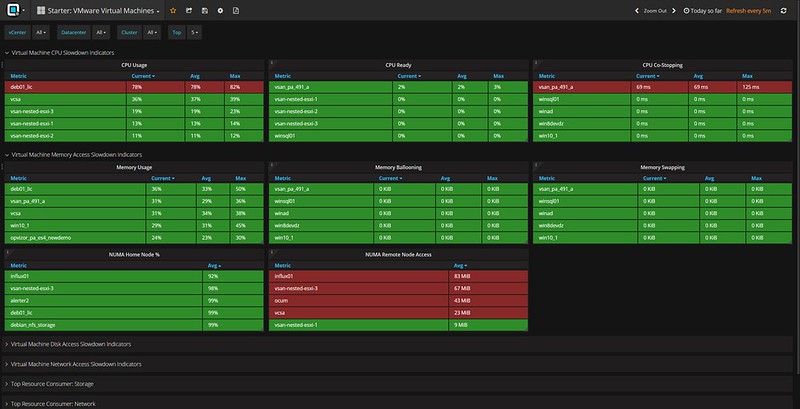
Oh, one more thing I found in the interface, it is these dashboards that deal with things like NUMA. But also things like the Top 10 VMs in terms of IOPS. Both very useful, especially when doing deep performance troubleshooting and optimizing.

I hope that gives you a sense of what they can do. There’s a fully functional 30-day trial, check it out if you want to find out more about Performance Analyzer or simply just want to play around with it. Opvizor announced this brand new version on their own blog here, make sure to give that a read as well!

Startup update: Runecast

Duncan Epping · Feb 16, 2018 ·

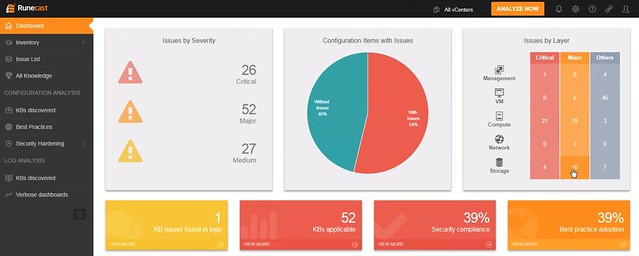
A while ago I introduced Runecast on my blog. I have known these guys for a while and this week I had to pleasure to be briefed on their new release: Runecast 1.7. The big ticket item in this release for sure it the vSAN Support. You may ask yourself why you would need Runecast when you have things like the health check and the “online” health check, well it seems that Runecast’s implementation covers more detail. Anyway, what is Runecast? As a company they refer to themselves as the knowledge automation experts, and I think that is a fair statement.

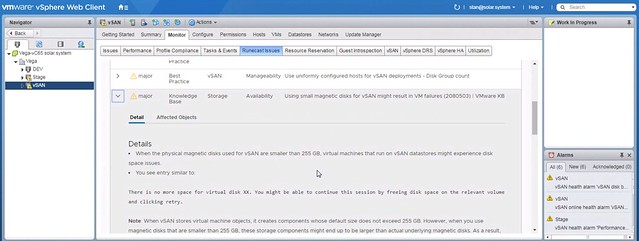
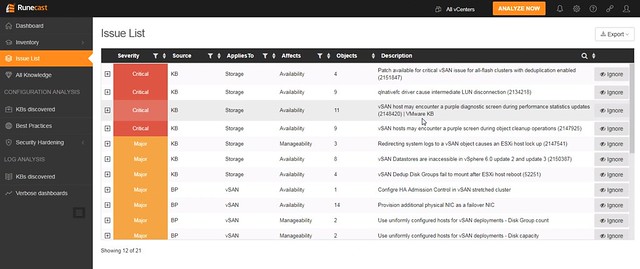
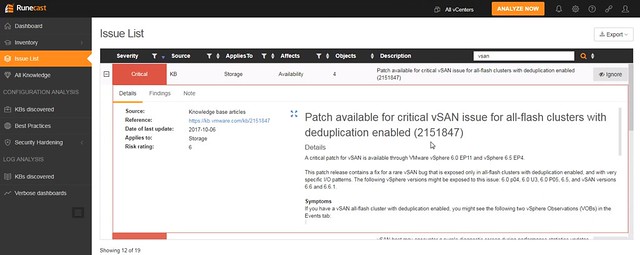
Runecast has developed an appliance which can be connected to one or multiple vCenter Server instances. After linking these you can “scan” the environment and Runecast will tell you about the risks. Not just from a security perspective, but it will also assess logs, configuration and even best practices. Your whole environment will be assessed in a report will be provided in a simple HTML-5 interface, or in the Web Client or the vSphere H5 client even. I said “simple”, but the information provided and the detail is far from simple… When I say simple I refer to their user interface. It is slick, and very easy to use.

Since I discussed Runecast last they added some additional features, like for instance a VRO plugin, full rest API, improved log search, Web Client and H5 client plugins but more importantly for many government agencies: DISA STIG compliancy checks. Yes, Runecast can check your environment against DISA STIG and report on any potential issues. Nice right?

This new release, version 1.7, now brings vSAN support. It also includes a new dashboard widget, which provides faster insights in how your environment is behaving. For vSAN in particular they didn’t only include KB article checks, but also implemented all best practices from the Design and Sizing guide, Network Design guide and the Stretched Cluster white paper. And they even hinted about adding best practices which are listed in the Essential vSAN book Cormac and I wrote, how cool is that? What is also nice is that their appliance is supported with vSAN 5.x and 6.x, and requires no direct access to the internet. You can simply download the appliance and install, and then update with the latest dataset by downloading an ISO.

Oh and before I forget, of course they also provide all the guidance and info needed around Spectre/Meltdown. Where normally their trial is limited, they actually do provide ALL info needed for Spectre/Meltdown as they realized that this is very valuable to customers and felt they could not hold this back.

For the Runecast blog on the 1.7 release go here.

  • Page 1
  • Page 2
  • Page 3
  • Interim pages omitted …
  • Page 10
  • Go to Next Page »

Primary Sidebar

About the Author

Duncan Epping is a Chief Technologist and Distinguished Engineering Architect at Broadcom. Besides writing on Yellow-Bricks, Duncan is the co-author of the vSAN Deep Dive and the vSphere Clustering Deep Dive book series. Duncan is also the host of the Unexplored Territory Podcast.

Follow Us

  • X
  • Spotify
  • RSS Feed
  • LinkedIn

Recommended Book(s)

Advertisements


Copyright Yellow-Bricks.com © 2025 · Log in