• Skip to primary navigation
  • Skip to main content
  • Skip to primary sidebar

Yellow Bricks

by Duncan Epping

  • Home
  • Unexplored Territory Podcast
  • HA Deepdive
  • ESXTOP
  • Stickers/Shirts
  • Privacy Policy
  • About
  • Show Search
Hide Search

memory

Memory Speeds?

Duncan Epping · Oct 10, 2011 ·

I was just checking out some of the VMworld Sessions and one that I really enjoyed was the one on “Memory Virtualization” session by Kit Colbert and YP Chien (#VSP2447). This session has a lot of nuggets but something I wanted to share is this script that YP Chien / Kingston showed up on stage. This script basically shows you at what speed your memory is capable of runing at. I asked Alan Renouf if he could test it as my lab is undergoing heavy construction. He tested it and mailed me back the output of the following script:

$cred = Get-Credential
$sessOpt = New-WSManSessionOption -SkipCACheck -SkipCNCheck -SkipRevocationCheck
$rsrcURI = "http://schemas.dmtf.org/wbem/wscim/1/cim-schema/2//CIM_PhysicalMemory"
foreach ($h in (Get-VMHost)) {
Write-Output $h.Name
Get-WSManInstance -ConnectionURI ("https`://" + $h.Name + "/wsman") -Authentication basic -Credential $cred -Enumerate -Port 443 -UseSSL -SessionOption $sessOpt -ResourceURI $rsrcURI | Select ElementName, @{N="Capacity (GB)";E={$_.Capacity / 1073741824.}}, MaxMemorySpeed
}

The output will look like this:

hostname01.local
ElementName    : DIMM1
Capacity (GB)  : 2
MaxMemorySpeed : 800

hostname02.local
ElementName    : DIMM1
Capacity (GB)  : 2
MaxMemorySpeed : 800

For those wondering what more you can get from CIM I would suggest reading this great article on the VMware PowerCLI blog.
Swap to host cache aka swap to SSD?

Duncan Epping · Aug 18, 2011 ·

Before we dive in to it, lets spell out the actual name of the feature “Swap to host cache”. Remember that, swap to host cache!

I’ve seen multiple people mentioning this feature and saw William posting a hack on how to fool vSphere (feature is part of vSphere 5 to be clear) into thinking it has access to SSD disks while this might not be the case. One thing I noticed is that there seems to be a misunderstanding of what this swap to host cache actually is / does and that is probably due to the fact that some tend to call it swap to SSD. Yes it is true, ultimately your VM would be swapping to SSD but it is not just a swap file on SSD or better said it is NOT a regular virtual machine swap file on SSD.

When I logged in to my environment first thing I noticed was that my SSD backed datastore was not tagged as SSD. First thing I wanted to do was tag it as SSD, as mentioned William already described this in his article and it is well documented in our own documentation as well so I followed it. This is what I did to get it working:

  • Check the NAA ID in the vSphere UI
  • Opened up an SSH session to my ESXi host
  • Validate which SATP claimed the device:
    esxcli storage nmp device list
    In my case: VMW_SATP_ALUA_CX
  • Verify it is currently not recognized as SSD by typing the following command:
    esxcli storage core device list -d naa.60060160916128003edc4c4e4654e011
    should say: “Is SSD : False”
  • Set “Is SSD” to true:
    esxcli storage nmp satp rule add -s VMW_SATP_ALUA_CX  –device naa.60060160916128003edc4c4e4654e011  –option=enable_ssd
  • I reloaded claim rules and ran them using the following commands:
    esxcli storage core claimrule load
    esxcli storage core claimrule run
  • Validate it is set to true:
    esxcli storage core device list -d naa.60060160916128003edc4c4e4654e011
  • Now the device should be listed as SSD

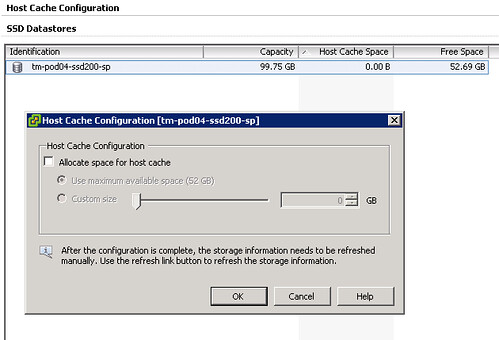
Next would be to enable the feature… When you go to your host and click on the “Configuration Tab” there should be a section called “Host Cache Configuration” on the left. When you’ve correctly tagged your SSD it should look like this:

Please note that I already had a VM running on the device and hence the reason it is showing some of the space as being in use on this device, normally I would recommend using a drive dedicated for swap. Next step would be enabling the feature and you can do that by opening the pop-up window (right click your datastore and select “Properties”). This is what I did:

  • Tick “Allocate space for host cache”
  • Select “Custom size”
  • Set the size to 25GB
  • Click “OK”

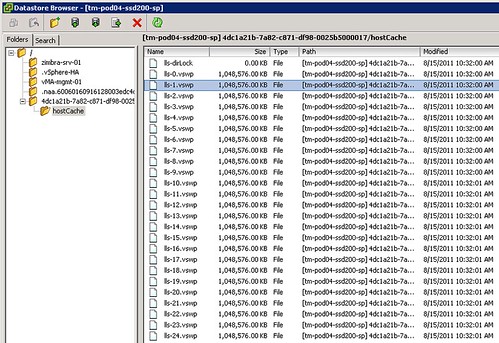
Now there is no science to this value as I just wanted to enable it and test the feature. What happened when we enabled it? We allocated space on this LUN so something must have been done with it? I opened up the datastore browser and I noticed a new folder was created on this particular VMFS volume:

Not only did it create a folder structure but it also created 25 x 1GB .vswp files. Now before we go any further, please note that this is a per host setting. Each host will need to have its own Host Cache assigned so it probably makes more sense to use a local SSD drive instead of a SAN volume. Some of you might say but what about resiliency? Well if your host fails the VMs will need to restart anyway so that data is no longer relevant, in terms of disk resiliency you should definitely consider a RAID-1 configuration. Generally speaking SAN volumes are much more expensive than local volumes and using local volumes also removes the latency caused by the storage network. Compared to the latency of a SSD (less than 100 μs), network latency can be significant. So lets recap that in a nice design principal:

Basic design principle
Using “Swap to host cache” will severely reduce the performance impact of VMkernel swapping. It is recommended to use a local SSD drive to elimate any network latency and to optimize for performance.

How does it work? Well fairly straight forward actually. When there is severe memory pressure and the hypervisor needs to swap memory pages to disk it will swap to the .vswp files on the SSD drive instead. Each of these, in my case, 25 files are shared amongst the VMs running on this host. Now you will probably wonder how you know if the host is using this Host Cache or not, that can of course simply be validated by looking at the performance statistics within vCenter. It contains a couple of new metrics of which “Swap in from host cache” and “Swap out to host cache” (and the “rate”…) metrics are most important to monitor. (Yes, esxtop has metrics as well to monitor it namely LLSWR/s  and LLSWW/s)

What if you want to resize your Host Cache and it is already in use? Well simply said the Host Cache is optimized to allow for this scenario. If the Host Cache is completely filled memory pages will need to be copied to the regular .vswp file. This could mean that the process takes longer than expected and of course it is not a recommended practice as it will decrease performance for your VMs as these pages more than likely at some point will need to be swapped in. Resizing however can be done on the fly, no need to vMotion away your VMs. Just adjust the slider and wait for the process to complete. If you decide to complete remove all host cache for what ever reason than all relevant data will be migrated to the regular .vswp.

What if the Host Cache is full? Normally it shouldn’t even reach that state, but when you run out of space in the host cache pages will be migrated from your host cache to your regular vswap file and it is first in first out in this case, which should be the right policy for most workloads. Now chances of course of having memory pressure to the extend where you fill up a local SSD are small, but it is good to realize what the impact is. If you are going down the path of local SSD drives with Host Cache enabled and will be overcommitting it might be good to do the math and ensure that you have enough cache available to keep these pages in cache rather than on rotating media. I prefer to keep it simple though and would probably recommend to equal the size of your hosts memory. In the case of a host with 128GB RAM that would be a 128GB SSD. Yes this might be overkill, but the price difference between 64GB and 128GB is probably neglect-able.

Basic design principle
Monitor swap usage. Although “Swap to host cache” will reduce the impact of VMkernel swapping it will not eliminate it. Take your expected consolidation ratio into account including your HA (N-X) strategy and size accordingly. Or keep it simple and just use the same size as physical memory.

One interesting use case could be to place all regular swap files on very cheap shared storage (RAID5 of SATA drives) or even local SATA storage using the “VM swapfile location” (aka. Host local swap) feature. Then install a host cache for any host these VMs can be migrated to. This should give you the performance of a SSD while maintaining most of the cost saving of the cheap storage. Please note that the host cache is a per-host feature. Hence in the time of a vMotion all data from the cache will need to be transferred to the destination host. This will impact the time a vMotion takes. Unless your vMotions are time critical, this should not be an issue though. I have been told that VMware will publish a KB article with advise how to buy the right SSDs for this feature.

Summarizing, Swap to SSD is what people have been calling this feature and that is not what it is. This is a mechanism that caches memory pages to SSD and should be referred to as “Swap to host cache”. Depending on how you do the math all memory pages can be swapped to and from SSD. If there is insufficient space available memory pages will move over to the regular .vswp file. Use local SSD drives to avoid any latency associated with your storage network and to minimize costs.

Which metric to use for monitoring memory?

Duncan Epping · Apr 29, 2011 ·

** PLEASE NOTE: This article was written in 2011 and discussed how to monitor memory usage, which is different then memory / capacity sizing. For more info on “active memory” read this article by Mark A. **

This question has come up several times over the last couple of weeks so I figured it was time to dedicate an article to it. People have always been used to monitoring memory usage in a specific way, mainly by looking at the “consumed memory” stats. This always worked fine until ESX(i) 3.5 introduced the aggressive usage of Large Pages. In the 3.5 timeframe that only worked for AMD processors that supported RVI and with vSphere 4.0 support for Intel’s EPT was added. Every architectural change has an impact. The impact is that TPS (transparent page sharing) does not collapse these so called large pages. (Discussed in-depth here.) This unfortunately resulted in many people having the feeling that there was no real benefit of these large pages, or even worse the perception that large pages are the root of all evil.

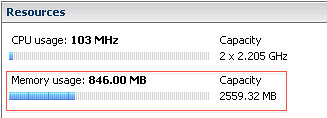
After having several discussions with customers, fellow consultants and engineers we managed to figure out why this perception was floating around. The answer was actually fairly simple and it is metrics. When monitoring memory most people look at the following section of the host – summary tab:

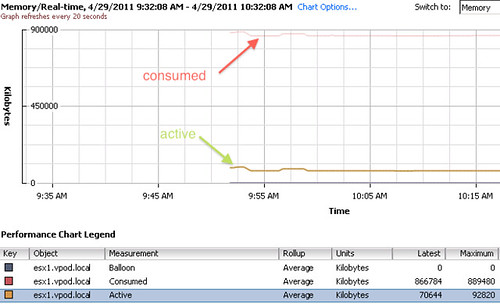
However, in the case of large pages this metric isn’t actually that relevant. I guess that doesn’t only apply to large pages but to memory monitoring in general, although as explained it used to be an indication.  The metric to monitor  is “active memory“. Active memory is is what the VMkernel believes is currently being actively used by the VM. This is an estimate calculated by a form of statistical sampling and this statistical sampling will most definitely come in handy when doing capacity planning. Active memory is in our opinion what should be used to analyze trends. Kit Colbert has also hammered on this during his Memory Virtualization sessions at VMworld. I guess the following screenshot is an excellent example of the difference between “consumed” and “active”. Do we need to be worried about “consumed” well I don’t think so, monitoring “active” is probably more relevant at this point! However, it should be noted that “active” represents a 5 minute time slot. It could easily be that the first 5 minute value observed is the same as the second, yet they are different blocks of memory that were touched. So it is an indication of how active the VM is. Nothing more than that.

MinFreePct 6% or should it be less?

Duncan Epping · Mar 17, 2011 ·

Back in the days when Servers still had 8GB or 16GB memory at most a setting was introduced that guaranteed the hypervisor had a certain amount of free memory to its disposal. The main purpose of this being of course stability of the system. As with any Operating System free memory is desirable to ensure it is available whenever a process requests it.. or should we say World in the case of ESXi.

These days however we hardly see environments with 8 or 16GB hosts…. No, most servers today have a minimum of 48GB and I guess the standard is 72 or 96GB. With 72GB and 96GB being the standard today one can imagine that 6% might be slightly going overboard. Especially in high density environments like VDI every single MB worth of of extra memory can and will be worth it. As such it might be beneficial to change that 6% back to 2%. This KB article has been around for a couple of weeks, and describes just that: http://kb.vmware.com/kb/1033687

Now you might wonder what happens if you change that 6% down to 2% as the memory states are closely related this is what many have published in the past:

  • 6% – High
  • 4% – Soft
  • 2% – Hard
  • 1% – Low

But is that really the case? What if I would change MinFreePct? Well I actually mentioned that in one of my previous articles. MinFreePct is defined as 6% however the other memory states are not fixed but rather a percentage of MinFreePct:

Free memory state thresholds {
soft:64 pct
hard:32 pct
low:16 pct
}

So that means that if you change the “High” watermark (6%) down to 2% the percentage that will trigger ballooning / compression / swap will also automatically change. Would I recommend changing MinFreePct? Well it depends, if you are running a high density VDI workload this might just give you that little extra you need but in most other cases I would leave it to the default. (For more on memory tuning for VDI read Andre’s article that he coincidentally published today.)

How cool is TPS?

Duncan Epping · Jan 10, 2011 ·

Frank and I have discussed this topic multiple times and it was briefly mentioned in Frank’s excellent series about over-sizing virtual machines; Zero Pages, TPS and the impact of a boot-storm. Pre-vSphere 4.1 we have seen it all happen, a host fails and multiple VMs need to be restarted. Temporary contention exists as it could take up to 60 minutes before TPS completes. Or of course when the memory pressure thresholds are reached the VMkernel requests TPS to scan memory and collapse pages if and where possible. However, this is usually already too late resulting in ballooning or compressing (if your lucky) and ultimately swapping. If it is an HA initiated “boot-storm” or for instance you VDI users all powering up those desktops at the same time, the impact is the same.

Now one of the other things I also wanted to touch on was Large Pages, as this is the main argument our competitors are using against TPS. Reason for this being that Large Pages are not TPS’ed as I have discussed in this article and many articles before that one. I even heard people saying that TPS should be disabled as most Guest OS’es being installed today are 64Bit and as such ESX(i) will back even Small Pages (Guest OS) by Large Pages and TPS will only add unnecessary overhead without any benefits… Well I have a different opinion about that and will show you with a couple of examples why TPS should be enabled.

One of the major improvements in vSphere 4.0 is that it recognizes zeroed pages instantly and collapses them. I have dug around for detailed info but the best I could publicly find about it was in the esxtop bible and I quote:

A zero page is simply the memory page that is all zeros. If a zero guest physical page is detected by VMKernel page sharing module, this page will be backed by the same machine page on each NUMA node. Note that “ZERO” is included in “SHRD”.

(Please note that this metric was added in vSphere 4.1)

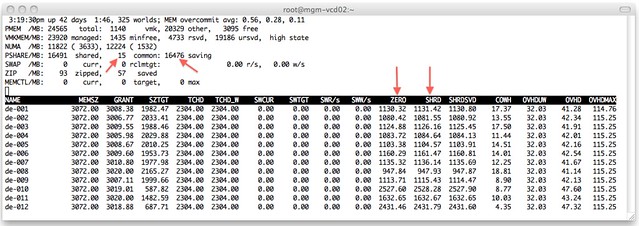
I wondered what that would look like in real life. I isolated one of my ESXi host (24GB of memory) in my lab and deployed 12 VMs with 3GB each with Windows 2008 64-Bit installed. I booted all of them up in literally seconds and as Windows 2008 zeroes out memory during boot I knew what to expect:

I added a couple of arrows so that it is a bit more obvious what I am trying to show here. On the top left you can see that TPS saved 16476MB and used 15MB to store unique pages. As the VMs clearly show most of those savings are from “ZERO” pages. Just subtract ZERO from SHRD (Shared Pages) and you will see what I mean. Pre-vSphere 4.0 this would have resulted in severe memory contention and as a result more than likely ballooning (if the balloon driver is already started, remember it is a “boot-storm”) or swapping.

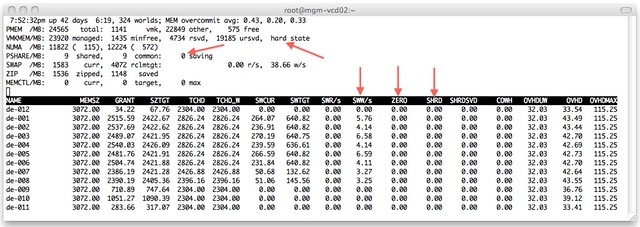
Just to make sure I’m not rambling I disabled TPS (by setting Mem.ShareScanGHz to 0) and booted up those 12 VMs again. This is the result:

As shown at the top, the hosts status is “hard” as a result of 0 page sharing and even worse, as can be seen on a VM level, most VMs started swapping. We are talking about VMkernel swap here, not ballooning. I guess that clearly shows why TPS needs to be enabled and where and when you will benefit from it. Please note that you can also see “ZERO” pages in vCenter as shown in the screenshot below.

One thing Frank and I discussed a while back, and I finally managed to figure out, is why after boot of a Windows VM the “ZERO” pages still go up and fluctuate so much. I did not know this but found the following explanation:

There are two threads that are specifically responsible for moving threads from one list to another. Firstly, the zero page thread runs at the lowest priority and is responsible for zeroing out free pages before moving them to the zeroed page list.

In other words, when an application / service or even Windows itself “deprecates” the page it will be zeroed out by the “zero page thread” aka garbage collector at some point. The Page Sharing module will pick this up and collapse the page instantly.

I guess there is only one thing left to say, how cool is TPS?!

  • « Go to Previous Page
  • Page 1
  • Page 2
  • Page 3
  • Page 4
  • Go to Next Page »

Primary Sidebar

About the Author

Duncan Epping is a Chief Technologist and Distinguished Engineering Architect at Broadcom. Besides writing on Yellow-Bricks, Duncan is the co-author of the vSAN Deep Dive and the vSphere Clustering Deep Dive book series. Duncan is also the host of the Unexplored Territory Podcast.

Follow Us

  • X
  • Spotify
  • RSS Feed
  • LinkedIn

Recommended Book(s)

Advertisements


Copyright Yellow-Bricks.com © 2025 · Log in