This was one fun episode. I just love talking to people about things that are relatively new to me, and AI/ML definitely is a relatively new topic for me. Justin Murray is VMware’s Tech Marketing guru on this topic and he had some great knowledge to share with us. On top of that, Justin just has a great way of simplifying/explaining things and always is a pleasure to see present/listen to. Either listen via the embedded player below or listen via Spotify: spoti.fi/3vtxjA6, Apple: apple.co/3ErCdSC, or anywhere else you get your podcasts!
vgpu
NVIDIA rendering issues? Look at the stats!
I’ve been down in the lab for the last week doing performance testing with virtual reality workloads and streaming these over wifi to an Oculus Quest headset. In order to render the graphics remotely, we leveraged NVIDIA GPU technology (RTX 8000 in my case here in the lab). We have been getting very impressive results, but of course at some point hit a bottleneck. We tried to figure out which part of the stack was causing the problem and started looking at the various NVIDIA stats through nvidia-smi. We figured the bottleneck would be GPU, so we looked at things like GPU utilization, FPS etc. Funny enough this wasn’t really showing a problem.
We then started looking at different angles, and there are two useful commands I would like to share. I am sure the GPU experts will be aware of these, but for those who don’t consider themselves an expert (like myself) it is good to know where to find the right stats. While whiteboarding the solution and the different part of the stacks we realized that GPU utilization wasn’t the problem, neither was the frame buffer size. But somehow we did see FPS (frames per second) drop and we did see encoder latency go up.
First I wanted to understand how many encoding sessions there were actively running. This is very easy to find out by using the following command. The screenshot below shows the output of it.
nvidia-smi encodersessions

As you can see, this shows 3 encoding sessions. One H.264 session and two H.265 sessions. Now note that we have 1 headset connected at this point, but it leads to three sessions. Why? Well, we need a VM to run the application, and the headset has two displays. Which results in three sessions. We can, however, disable the Horizon session using the encoder, that would save some resources, I tested that but the savings were minimal.
I can, of course, also look a bit closer at the encoder utilization. I used the following command for that. Note that I filter for the device I want to inspect which is the “-i <identifier>” part of the below command.
nvidia-smi dmon -i 00000000:3B:00.0
The above command provides the following output, the “enc” column is what was important to me, as that shows the utilization of the encoder. Which with the above 3 sessions was hitting 40% utilization roughly as shown below.

How did I solve the problem of the encoder bottleneck in the end? Well I didn’t, the only way around that is by having a good understanding of your workload and proper capacity planning. Do I need an NVIDIA RTX 6000 or 8000? Or is there a different card with more encoding power like the V100 that makes more sense? Figuring out the cost, performance and the trade-off here is key.
Two more weeks until the end of my Take 3 experience, and what a ride it has been. If you work for VMware and have been with the company for 5 years… Consider doing a Take 3, it is just awesome!
vGPUs and vMotion, why the long stun times?
 Last week one of our engineers shared something which I found very interesting. I have been playing with Virtual Reality technology and NVIDIA vGPUs for 2 months now. One thing I noticed is that we (VMware) introduced support for vMotion in vSphere 6.7 and support for vMotion of multi vGPU VMs in vSphere 6.7 U3. In order to enable this, you need to set an advanced setting first. William Lam described this in his blog how to set this via Powershell or the UI. Now when you read the documentation there’s one thing that stands out, and that is the relatively high stun times for vGPU enabled VMs. Just as an example, here are a few potential stun times with various sized vGPU frame buffers:
- 2GB – 16.5 seconds
- 8GB – 61.3 seconds
- 16GB – 100+ seconds (time out!)
This is all documented here for the various frame buffer sizes. Now there are a couple of things to know about this. First of all, the time mentioned was tested with 10GbE and the NVIDIA P40. This could be different for an RTX6000 or RTX8000 for instance. Secondly, they used a 10GbE NIC. If you use multi-NIC vMotion or for instance a 25GbE NIC than results may be different (times should be lower). But more importantly, the times mentioned assume the full frame buffer memory is consumed. If you have a 16GB frame buffer and only 2GB is consumed then, of course, the stun time would be lower than the above mentioned 100+ seconds.
Now, this doesn’t answer the question yet, why? Why on earth are these stun times this long? The vMotion process is described in this blog post by Niels in-depth, so I am not going to repeat it. It is also described in our Clustering Deep Dive book which you can download here for free. The key reason why with vMotion the “down time” (stun times) can be kept low is that vMotion uses a pre-copy process and tracks which memory pages are changed. In other words, when vMotion is initiated we copy memory pages to the destination host, and if a page has changed during that copy process we mark it as changed and copy it again. vMotion does this until the amount of memory that needs to be copied is extremely low and this would result in a seamless migration. Now here is the problem, it does this for VM memory. This isn’t possible for vGPUs unfortunately today.
Okay, so what does that mean? Well if you have a 16GB frame buffer and it is 100% consumed, the vMotion process will need to copy 16GB of frame buffer memory from the source to the destination host when the VM is stunned. Why when the VM is stunned? Well simply because that is the point in time where the frame buffer memory will not change! Hence the reason this could take a significant number of seconds unfortunately today. Definitely something to consider when planning on using vMotion on (multi) vGPU enabled VMs!
Disabling the frame rate limiter for your vGPU
I have been testing with Virtual Reality apps within a VM for the past few days and I am leveraging NVIDIA vGPU technology on vSphere 6.7 U3. I was running into some undesired behavior and was pointed to the fact that this could be due to the frame rate being limited by default (Thank Ben!). I first checked the head-mounted display to see at what kind of frame rate it was running, by leveraging “adbLink” (for Mac) and the logcat command I could see the current frame rate hovering between 55-60. For virtual reality apps that leads to problems when moving your head from left to right as you will see black screens. For the Quest, for those wanting to play around with it as well, I used the following command to list the current frame rate for the NVIDIA CloudXR application (note that this is specific to this app) and “-s” filters for the keyword “VrApi”:
logcat -s VrApi
The result will be a full string, but the important bit is the following:
FPS=72,Prd=32ms,Tear=0,Early=0
I was digging through the NVIDIA documentation and it mentioned that if you used the Best Effort scheduler a frame rate limit would be applied. I wanted to test with the different schedulers anyway so I switched over to the Equal Share scheduler, which solved the problems listed above as it indeed disabled the frame rate limit. I could see the frame rate going up between 70 and 72. Of course, I also wanted to validate the “best effort” scheduler with frame rate limit disabled, I did this by adding an advanced setting to the VM:
pciPassthru0.cfg.frame_rate_limiter=0
This also resulted in a better experience, and again the frame rate going up to 70-72.
Adding multiple vGPUs to a Virtual Machine
Last week we have been testing with vGPUs in our lab for our Virtual Reality applications. We also had the need to do some rendering. The rendering that we needed to do required a lot of GPU power so we figured we would test the rendering within a virtual machine using a vGPU. This by itself worked fairly well with a single vGPU with a grid_rtx8000p-12q vGPU profile. The next thing we wanted to test was having multiple vGPUs associated with a single Virtual Machine. We have vSphere 6.7 U3 in our lab, so that should be fully supported. The first thing you will need to do is make sure your VMs are VM compatibility version 15. Without 15 you can’t even add a second vGPU, to begin with.
We added the two vGPUs to our environment and tried to power it on. Below screenshots show the vGPUs configured followed, unfortunately, by a screenshot of the error message we received. For completeness sake and search engine goodness here is the error message I received in text:
Could not initialize plugin '/usr/lib64/vmware/plugin/libnvidia-vgx.so'


I did some digging and figured out that the NVIDIA Documentation explained why, you can only add multiple vGPUs using a particular profile. The VMware guidance on this is a bit fuzzy unfortunately, but I requested the blog post to be edited. The NVIDIA document is very clear, you can only use the 48q or 48c profile with the RTX8000. For the various cards this is documented here. After adding two vGPUs with the 48q profile, like shown below, the VM powers on perfectly, well after you powered off any other workload using a vGPU that is, as the 48q/c profile claims the full card!

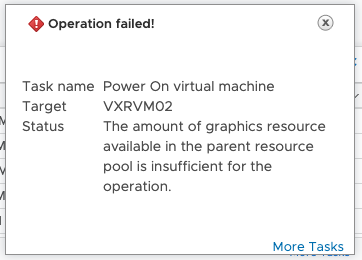
And for completeness sake, if you don’t power off the other VMs using a vGPU then you will receive the following error:
the amount of graphics resource available in the parent resource pool is insufficient for the operation.
Which is also shown in the below screenshot.
So to recap, if you want to use multiple vGPUs here are the requirements/constraints:
- vSphere 6.7 Update 3 is required
- VM Compatibility Version 15 is required
- Only “q” anc “c” profiles are supported
- You need to select the full frame buffer for each vGPU (highest), for RTX8000 that would be 48q or 48c
- This results in not being able to run any other vGPUs on those physical cards
- This also means that you need a physical card per vGPU you want to assign, two vGPUs requires two physical GPUs!
- Maximum of 4 vGPUs per VM
I hope this helps someone who is planning on configuring something similar.