• Skip to primary navigation
  • Skip to main content
  • Skip to primary sidebar

Yellow Bricks

by Duncan Epping

  • Home
  • ESXTOP
  • Stickers/Shirts
  • Privacy Policy
  • About
  • Show Search
Hide Search

performance

Cool fling: vSAN Performance Monitor

Duncan Epping · Aug 23, 2019 ·

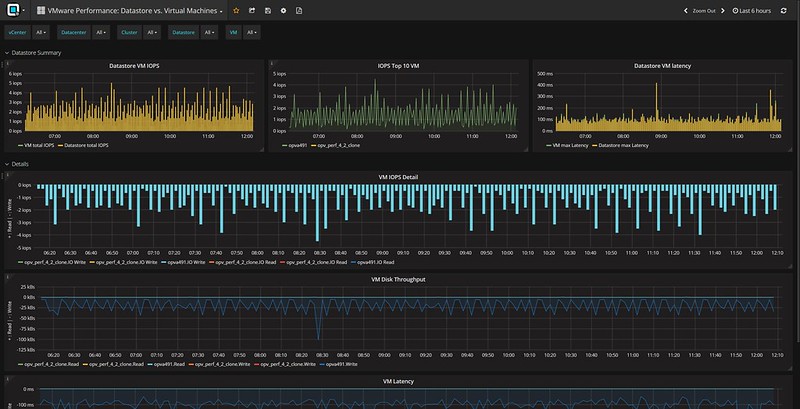
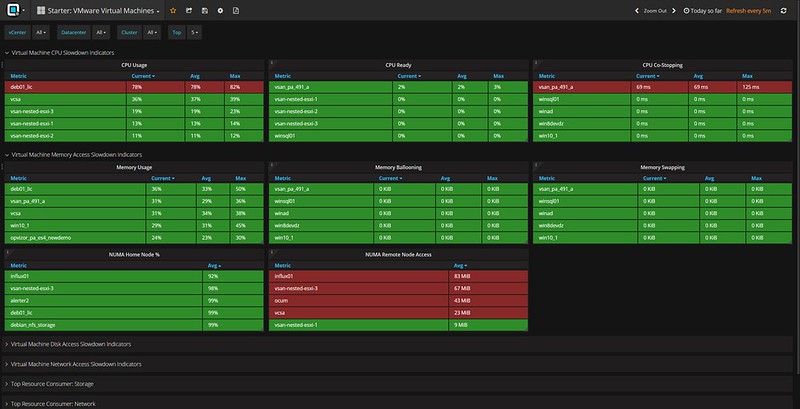
The vSAN team has just published a cool fling, the vSAN Performance Monitor. This performance monitor allows you to monitor multiple clusters at once, or as the team describes it:

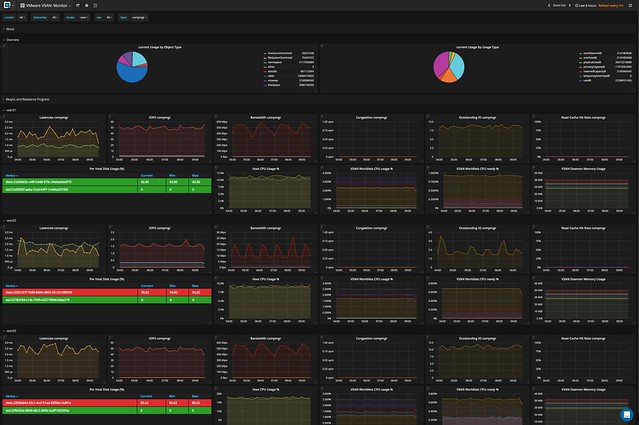
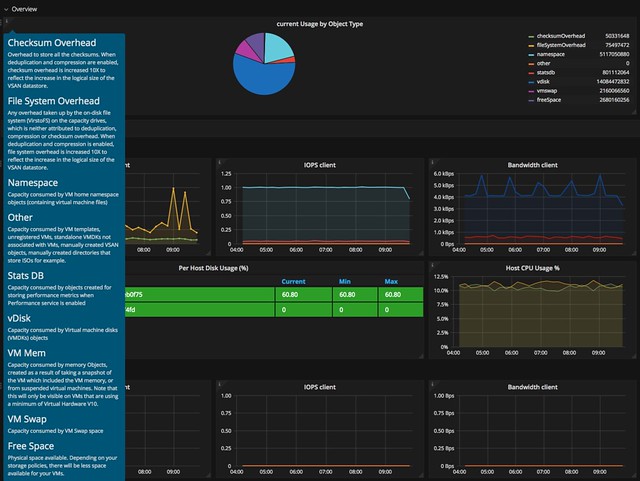
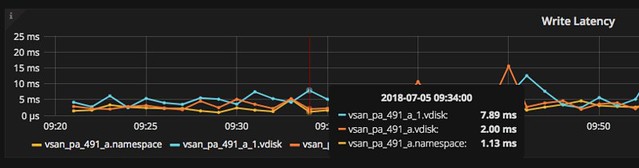
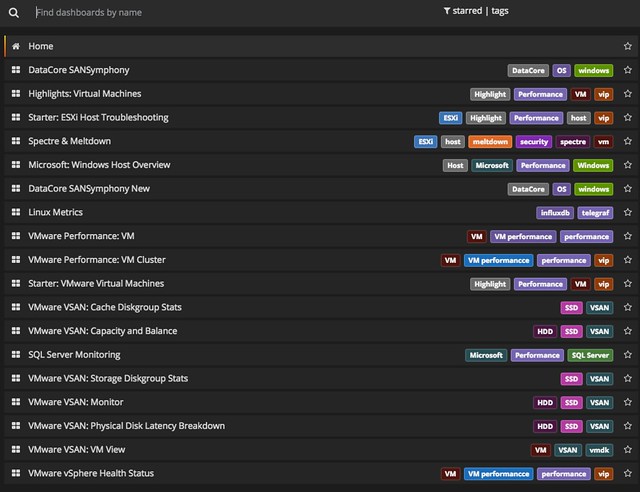
The vSAN performance monitor is a monitoring and visualization tool based on vSAN Performance metrics. It will collect vSAN Performance and other metrics periodically from the clusters configured. The data collected is visualized in a more efficient and user-friendly way. The vSAN performance monitor comes with preconfigured dashboards which will help customers evaluate the performance of vSAN clusters, identify and diagnose problems, and understand current and future bottlenecks. The dashboards are heavily inspired by vSAN Observer.

It leverages Grafana for the frontend to visualize the metrics which are stored in an InfluxDB and collected by Telegraf. It is pretty simple to set up and it is made available for free via the Flings website. You can download an OVA and a User Manual to configure. Please note that it does require you to be on vSphere 6.0 or higher, but hopefully everyone is by now!

PS: Yes I know there was an issue with the upload of the OVA, I reported that with the dev team and it has been fixed since! Yes I tested it, and it does indeed import and boot correctly.

Must read white paper: Persistent Memory performance with vSphere 6.7

Duncan Epping · Aug 14, 2018 ·

Today I noticed this whitepaper titled: Persistent Memory Performance on vSphere 6.7. An intriguing topic for sure as it is something “relatively new and something I haven’t encountered too much in the field. Yes, I talk about Persistent Memory, aka NVDIMMs, in my talks usually but then it typically relates to vSAN. I have not seen too many publications from VMware on this topic, so I figured I would share this publication with you:

  • Persistent Memory Performance in vSphere 6.7 – https://www.vmware.com/content/dam/digitalmarketing/vmware/en/pdf/techpaper/performance/pmem-vsphere67-perf.pdf
    Persistent memory (PMEM) is a new technology that has the characteristics of memory but retains data through power cycles. PMEM bridges the gap between DRAM and flash storage. PMEM offers several advantages over current technologies like:

    • DRAM-like latency and bandwidth
    • CPU can use regular load/store byte-addressable instructions
    • Persistence of data across reboots and crashes

The paper starts with a brief intro and then explains the different modes in which PMEM can be used, either as a “disk” (vPMEMDisk) or surfaced up to the guest OS as an NVDIMM (vPMEM). With the latter option, there’s also the ability to have some form of application awareness, which is referred to as the 3rd mode (vPMEM-aware).

I am not going to copy and paste the findings, as the paper has a lot of interesting data and you should go through it. One thing I found most interesting is the huge decrease in latency. Anyway, read the paper and get familiar with persistent memory / NVDIMMs, as this technology will start changing the way we design HCI platforms in the future and cater for low latency / high throughput applications in traditional environments.

Opvizor Performance Analyzer for vSAN

Duncan Epping · Jul 10, 2018 ·

At a VMUG a couple of months ago I bumped into my old friend Dennis Zimmer. Dennis told me that he was working on something cool for vSAN but couldn’t reveal what it was just yet. Last week I had a call with Dennis about what that thing was. Dennis is the CEO for Opvizor, and some of you may recall the different tooling that Opvizor has produced over the years, of which the Health Analyzer was probably the most famous one back then. I’ve used it in the past on various occasions and I had various customers using it. During the briefing, Dennis explained to me that Opvizor started focussing on performance monitoring and analytics a while ago as the health analyzer market was overly crowded and had the issue that is was a one-off business (checks once in a while instead of daily use). On top of that, many products now come with some form of health analysis included. (See vSAN for instance.) I have to agree with Dennis, so this pivot towards Performance Monitoring makes much sense to me.

Dennis explained to me how they are seeing more and more customer demand for vSAN performance monitoring especially combined with VMware ESXi, VM and App data. Although vCenter has various metrics, and there’s VROps, he told me that Opvizor has many customers who need more than vCenter or vROPS standard has to offer today and don’t own VROps advanced. This is where Opvizor Performance Analyzer comes in to play and that is why today Opvizor announced they are including vSAN specific dashboards. Now, this isn’t just for vSAN of course. Opvizor Performance Analyzer includes not just vSAN but also vSphere and various other parts of the stack. When talking with Dennis one thing became clear, Opvizor is taking a different approach than most other solutions. Where most focus on simplifying, hiding, and aggregating, the focus for Opvizor is on providing as much relevant detail as possible to fulfill the needs of beginner and professional.

So how does it work? Opvizor provides a virtual appliance. You simply deploy it in your environment and connect it to vCenter and you are ready to go. The appliance collects data every 5 minutes (but 20 seconds intervals of these 5 minutes) and has a retention of up to 5 years. As I said, the focus is on infrastructure statistics and performance analytics and as such Opvizor delivers all the data you ever need.

It doesn’t just provide you with all the info you will ever need. It will also allow you to overlay different metrics, which makes performance troubleshooting a lot easier, and will allow you to correlate and pinpoint particular problems. Opvizor comes with dashboards for various aspects, here are the ones included in the upcoming release for vSAN:

  • Capacity and Balance
  • Storage Diskgroup Stats
  • VM View
  • Physical disk latency breakdown
  • Cache Diskgroup stats
  • vSAN Monitor

Now I said this is the expert´s troubleshooting tool, but Opvizor Performance Analyzer also provided in-depth information about what each metric is / means and provides starter dashboards for beginners. You can simply click on the “i” in the top left corner of the widget and you get all the info about that particular widget.

When you do know what you are looking for you can click, hover, and zoom when needed. Hover over the specific section in the graph and the point in time values of the metrics will pop up. In the case below I was drilling down on a VM in the vSAN cluster and looking at write latency in specific. As you can see we have 3 objects and in particular 2 disks and a “vm name space”.

And this is just a random example, there are many metrics to look at and many different widgets and overviews. Just to give you an idea, here are some of the metrics you can find in the UI:

  • Latency (for all different components of the stack)
  • IOPs (for all different components of the stack)
  • Bandwidth (for all different components of the stack)
  • Congestion (for all different components of the stack)
  • Outstanding I/O (for all different components of the stack)
  • Read Cache Hit rate (for all different components of the stack)\
  • ESXi vSAN host disk usage
  • ESXi vSAN host cpu usage
  • Number of Components
  • Disk Usage
  • Cache Usage

And there;s much more, too many to list in this blog. And again, not just vSAN, but there are many dashboards to chose from. If you don’t have a performance monitoring solution yet and you are evaluating solutions like SolarWinds, Turbunomics and others make sure to add Opvizor to that list. One thing I have to say, I spotted a couple of things that I liked to see changed, and I think within 24hrs the Opvizor guys managed to incorporate the feedback. That was a crazy fast turnaround, good to see how receptive they are.

Oh, one more thing I found in the interface, it is these dashboards that deal with things like NUMA. But also things like the Top 10 VMs in terms of IOPS. Both very useful, especially when doing deep performance troubleshooting and optimizing.

I hope that gives you a sense of what they can do. There’s a fully functional 30-day trial, check it out if you want to find out more about Performance Analyzer or simply just want to play around with it. Opvizor announced this brand new version on their own blog here, make sure to give that a read as well!

Where is the vSAN storage performance proactive test in vSphere 6.5 U1 patch 02?

Duncan Epping · Jan 16, 2018 ·

I had some customers asking where the storage performance proactive test and the multicast proactive test was in the latest release of vSAN. In the past this is what the UI looked like when they would go to the Proactive Test section:

proactive test disappeared

But now it looks like this:

proactive test disappeared

What happened? Well, two tests have been removed. I guess most people will understand why the Multicast test has been removed, with the disappearance of Multicast in vSAN the test was not needed any longer. To be clear, if you are running vSAN in unicast mode the test will not show, if you are running in multicast mode however then of course the test will still be shown. But what about the Storage Performance Test?

We have noticed that most customers were using HCI Bench when doing benchmarks or using their own tooling (please don’t use legacy tools). Those who were using the proactive test often drew incorrect conclusions as it does not provide the flexibility a solution like HCI Bench offers. VMware felt that HCI Bench was a more suitable solution for doing benchmarks and this is definitely VMware’s recommended solution, as such the decision was made to focus on HCI Bench from a development perspective and deprecate the perf benchmark feature in the Proactive Tests section.

Benchmarking an HCI solution with legacy tools

Duncan Epping · Nov 17, 2016 ·

I was driving back home from Germany on the autobahn this week when thinking about 5-6 conversations I have had the past couple of weeks about performance tests for HCI systems. (Hence the pic on the rightside being very appropriate ;-)) What stood out during these conversations is that many folks are repeating the tests they’ve once conducted on their legacy array and then compare the results 1:1 to their HCI system. Fairly often people even use a legacy tool like Atto disk benchmark. Atto is a great tool for testing the speed of your drive in your laptop, or maybe even a RAID configuration, but the name already more or less reveals its limitation: “disk benchmark”. It wasn’t designed to show the capabilities and strengths of a distributed / hyper-converged platform.

Now I am not trying to pick on Atto as similar problems exist with tools like IOMeter for instance. I see people doing a single VM IOMeter test with a single disk. In most hyper-converged offerings that doesn’t result in a spectacular outcome, why? Well simply because that is not what the solution is designed for. Sure, there are ways to demonstrate what your system is capable off with legacy tools, simply create multiple VMs with multiple disks. Or even with a single VM you can produce better results when picking the right policy as vSAN allows you to stripe data across 12 devices for instance (which can be across hosts, diskgroups etc). Without selecting the right policy or having multiple VMs, you may not be hitting the limits of your system, but simply the limits of your VM virtual disk controller, host disk controller, single device capabilities etc.

But there is even a better option, pick the right toolset and select the right workload(Surely only doing 4k blocks isn’t representative of your prod environment). VMware has developed a benchmarking solution that works with both traditional as well as with hyper-converged offerings called HCIBench. HCIBench can be downloaded for free, and used for free, through the VMware Flings website. Instead of that single VM single disk test, you will now be able to test many VMs with multiple disks to show how a scale-out storage system behaves. It will provide you great insights of the capabilities of your storage system, whether that is vSAN or any other HCI solution, or even a legacy storage system for that matter. Just like the world of storage has evolved, so has the world of benchmarking.

  • Go to page 1
  • Go to page 2
  • Go to page 3
  • Interim pages omitted …
  • Go to page 20
  • Go to Next Page »

Primary Sidebar

About the author

Duncan Epping is a Chief Technologist in the Office of CTO of the Cloud Platform BU at VMware. He is a VCDX (# 007) and the author of the "vSAN Deep Dive" and the “vSphere Clustering Technical Deep Dive” series.

Upcoming Events

14-Apr-21 | VMUG Italy – Roadshow
26-May-21 | VMUG Egypt – Roadshow
May-21 | Australian VMUG – Roadshow

Recommended reads

Sponsors

Want to support us? Buy an advert!

Advertisements

Copyright Yellow-Bricks.com © 2021 · Log in