Ever since ESX 2.5 I have always been looking for cool free tools to monitor my hosts. I guess one of the oldest free tools out there is vmktree. Especially in the 2.x timeframe vmktree helped me out solving some weird performance issues. Back then vmktree was still dependent on vmkusage (who remembers that one?) but as of ESX 3.0 vmktree utilizes the api to gather the details needed to plot the graphs.
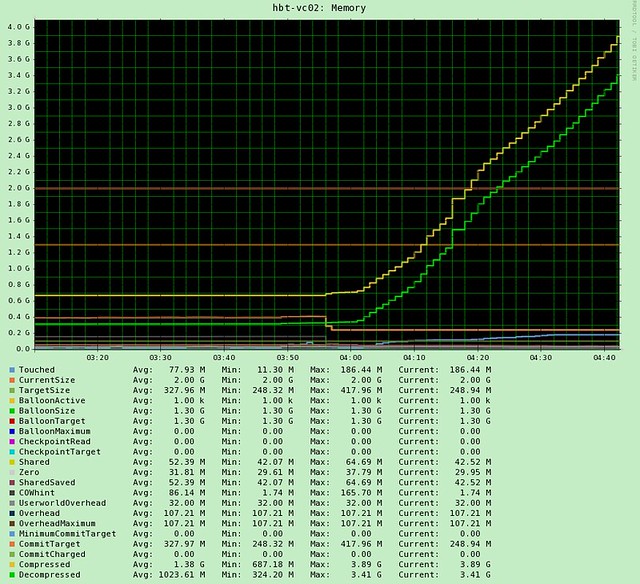
I lost track of vmktree for a while but when I noticed the announcement this week that 0.4.1 was released I decided to give it a spin again. I logged into my vSphere Management Appliance (vMA) and downloaded vmktree with wget. Installed it following the procedures mentioned in the announcement and literally minutes later I could see the first values coming in. To make sure I had something to show you guys I added a limit of 200MB on a virtual machine. As you know I love esxtop but esxtop are still just “dry numbers” which makes it difficult to see a trend. As you can see in the following screenshot, vmktree makes this trend pretty obvious. (Balloon driver is really active and the size of the balloon is increasing._
Besides memory, of course vmktree has more to offer on both per VM and Host level. For instance on a per VM level you can also see CPU and Storage statistics. On a Host level you can see CPU, Storage and Network. Of course these would include things like Latency, Bus resets, dropped packets, disk space usage… you name it, it is in there.
I know there are a lot of vendors these days offering free monitoring solutions, but the cool thing about vmktree is that it is maintained by just a single person Lars Troen. I can only imagine how much work maintaining a tool like this is. Thanks Lars for helping me out by writing this excellent tool! I would like to ask everyone to give it a try, and of course to provide feedback to Lars so that he can possibly improve vmktree over time.
This is a cool tool indeed! It produces easy-to-read graphs.
The only thing I realy don’t like about the tool is the fact SSH needs to be enabled.
Thanks Duncan for posting this.. I religiously follow everything that you say like the word of god :). I tried this tool out but seems like remote tech support needs to be enabled on my ESXi hosts inorder for this to work. Doesnt that put me at odds with VMware support if an issues comes up? My understanding is that it is supposed to be turned off at all times unless a VMware tech requires you to do otherwise. Is that the case?
You do have a point here, Bilal.
The reason you need to enable Remote Tech Support mode (ssh) is that it is the only method known to me where I can do a dump of raw VSI values.
The alternative would be to collect data the official way which means that you collect data from time A to time B and get an average number for the value you’re collecting. The keep repeating to start and stop data collection.
Some of the values we collect in vmktree was earlier (ESX3) not available through official methods. I know that this might not be an issue anymore as the official API has improved, and I have been (and still do) considering to rewrite the data collector, but as you know.. Reinventing the wheel will take quite a few man hours and I’m not even guaranteed that the result be equally good.
Lars
Lars,
Thank you for the quick response. To be honest, I could care less about enabling SSH, the only issue I would have is that VMware may not like that. But I do see the reason why you have used the approach you are using.
To sum it all up, do I think this toll is good? Are you kidding me? It’s awesome and if it wasnt for your efforts and Duncan’s blog, I would have never found it. I hope you do get time to see if somehow this could be used with SSH disabled, I would really love to have it running in my production servers. That would be great help. However, I also understand how much time that will involve. In the end, hats off to you… Awesome tool!
Lars,
Over the last few months I have realized the importance of documentation. In order to keep up with that, I have created a site where I posts stuff basically to remind myself of things for future. I had to add vmktree in there, so that I can keep track of what changes you bring to this in the future.. Thanks Duncan and Lars!
http://www.bilalhashmi.com/bilal/articles/60-vmktree-and-esxi-.html
Hi,
I successfully installed it, thanks it’s working great.
I have a question :
Where is stored the data ? I see a “year” button, so I guess data retention is 1 year ?
Since my vma is just a test machine with low disk amount, how can I know how much disk space vmktree is going to eat ?
Thanks
Also, is there an uninstall method ?
Sharantyr,
Data is stored for ~2 years (768 days). You can get a 2 year view by first going to 1 year and then click “Zoom out”.
Amount of disk space depends on how many nics, hbas, luns etc you have in both your physical and virtual machines.
Each ESX host typically takes up between 50-100MB and each VM 5-15MB.
I’ll include an uninstall script for the upcoming version of vmktree. Until further you can use the following procedure:
1.
crontab -e
Delete the vmktree entries (1 per host) and save. This stops data collection.
2.
grep location.www /etc/vmktree.conf
grep location.cgi /etc/vmktree.conf
grep location.data /etc/vmktree.conf
The above commands will reveal the location of the directories used by vmktree. You can now delete these.
3.
rm /etc/vmktree.conf
The above command deletes the vmktree config file.
Good luck!
Lars
Ok, thank you 🙂
I’m using ESXi 4.1 and on “Virtual Machines”, the “Disk Latency” column is not filled (neither “nic blocks/s”).
I think of 2 nice improvements :
1
Show the actual data usage of the graphs + the estimated maximum size based on the current count of hosts + vm + hba + nics + etc. (As you written above).
2
The possibility to choose which counters show on the “ESX Hosts” and “Virtual Machines”.
Exemple : I think %used memory on “Virtual Machine” could be a nice indicator, but not all may think the same.
Anyway thanks for this nice work. You should mention, at the end of the installation, the warning for ESXi hosts not keeping files ( http://www.how2blog.de/?p=101 )
Sharantyr,
The data allocated is not growing over time unless your environment is a changing on (which is likely). All the disk space needed to collect for 2 years is preallocated per host and per VM.
Disk space is not currently cleaned up for deleted VMs and hosts so you will need to use tmpreaper or similar if you’re having a VMware View environment with linked clones or similar.
I’ll see what I can do about your second suggestion.
Thanks again for your feedback.
Lars
I think my bad english makes me hard to understand 😉
About my first suggestion, I was thinking for a counter on the http interface.
Like
You have a total of X hosts and Y VMs, which make the database size max Z Mb. Disk usage W %.
Or something similar? Just an idea anyway.
Good luck 🙂
PS : “Disk Latency” column is not filled – is that an ESXi issue ?