• Skip to primary navigation
  • Skip to main content
  • Skip to primary sidebar

Yellow Bricks

by Duncan Epping

  • Home
  • ESXTOP
  • Stickers/Shirts
  • Privacy Policy
  • About
  • Show Search
Hide Search

cool

Runecast Analyzer 3.0!

Duncan Epping · Aug 21, 2019 ·

This week I had a brief conversation with the folks from Runecast. I have been following them since day 1 and they have made a big impression on me from the start. During the conversation the Runecast folks shared with me that Runecast Analyzer 3.0 was going to be announced today and they gave a quick overview and demo of what would be announced and included in 3.0. They also quickly went over the functionality that was added the past year, some things which really were well adopted by customers were HIPAA and DISA-STIG compliance feature. Also Horizon support and security auto-remediation capabilities. Another thing that customers really appreciated were the upgradability simulations (beta feature), where Runecast validates your environment against the HCL.

Stan (Runecast CEO) also mentioned that this year Runecast signed up a customer with over 10k hosts, as you can imagine a lot of the work in the past 12 months was focused on scalability and performance at that level of scale. But that is not what today’s announcement is about, today Runecast is announcing 3.0. In 3.0 there are some great enhancements to the platform again. First of all, production-ready HCL Analysis for vSphere and vSAN. On top of that, the ESXi Upgrade Simulation is now GA, and the log analysis has been improved. Runecast is also introducing a new H5 Client plugin-in with new widgets and a dark theme! Just look at it below, you have got to love the dark theme!

But as I mentioned, there’s more to it than just the H5 Client Plugin, the HCL Analysis and the Upgrade Simulation are two key features if you ask me. During the demo, Stan showed me the below screen, and I think that by itself makes it worth testing out Runecast. It simply shows you in one overview if your environment is compliant to the HCL or not, and if it is not compliant, which combination of firmware and driver you should be using to make it compliant. In this example, the driver should be upgraded to 2.0.42. A very useful feature if you ask me. Note that this will work for both vSphere and vSAN and all components needed to run either of these.

Just as useful is the Upgrade Simulation by the way, are you considering upgrading? Make sure to run this first so you know if you will end up in a supported state or not?! And some of you may say that VMware has similar capabilities in their product, but the Runecast appliance doesn’t need to be connected to the internet at all times. You can regularly update the dataset and run these compliancy and upgrade checks (or any of the other checks) regularly offline. Especially for customers where internet access is challenging (dark sites) this is very helpful.

All in all, some very useful updates to an already very useful solution.
Cool tool update: RVTools 3.3 released!

Duncan Epping · Apr 24, 2012 ·

Rob de Veij just published RVTools 3.3. I know many of you are using it and I definitely suggest downloading the latest version! RVTools has been downloaded more than 100.000, so definitely worth checking out if you had not so far! Here are the changes in this release:

Version 3.3 (April, 2012)

  • GetWebResponse timeout value changed from 5 minutes to 10 minutes (for very big environments)
  • New tabpage with HBA information
  • On vDatastore tab the definition of the Provisioned MB and In Use MB columns was confusing! This is changed now.
  • RVToolsSendMail accepts now multiple recipients (semicolon is used as separator)
  • Folder information of VMs and Templates are now visible on vInfo tabpage
  • Bugfix: data in comboboxes on filter form are now sorted
  • Bugfix: Problem with api version 2.5.0 solved
  • Bugfix: Improved exception handling on vCPU tab.
  • Bugfix: Improved exception handling on vDatastore tab.

Cool Tool Update: RVTools 3.0

Duncan Epping · Jan 23, 2011 ·

When I was enjoying some family time yesterday Eric Sloof stole my usual RVTools scoop. Nevertheless I believe it is worth publishing this as RVTools is one of the most valuable free non-vendor tools out there. Rob de Veij released a major version of RVTools. There are couple of major improvements in this version and hence the reason it took Rob slightly longer than expected to come with this update.

Here are the improvements in RVTools 3.0:

  • Pass-through authentication implemented. Allows you to use your logged on Windows credentials to automatically logon.
  • All numeric columns are now formated to make it more readable.
  • On vInfo the columns Commited, Uncommited, Shared and on vSnapshot the column size are now formated in MBs instead of bytes.
  • New tabpage created with service console and VMKernel information.
  • Now using vSphere Web Services SDK 4.1 which supports the new features available in vSphere 4.1
  • Export to csv file now uses Windows regional separator
  • Using NPOI to make it possible to write directly to xls files without the need for a installed Excel version on the system.
  • New menu function to write all information to one excel workbook with for each tabpage a new worksheet.
  • New command line options. Check the documentation!

Download it now,

Cool Tool: vmktree

Duncan Epping · Dec 23, 2010 ·

Ever since ESX 2.5 I have always been looking for cool free tools to monitor my hosts. I guess one of the oldest free tools out there is vmktree. Especially in the 2.x timeframe vmktree helped me out solving some weird performance issues. Back then vmktree was still dependent on vmkusage (who remembers that one?) but as of ESX 3.0 vmktree utilizes the api to gather the details needed to plot the graphs.

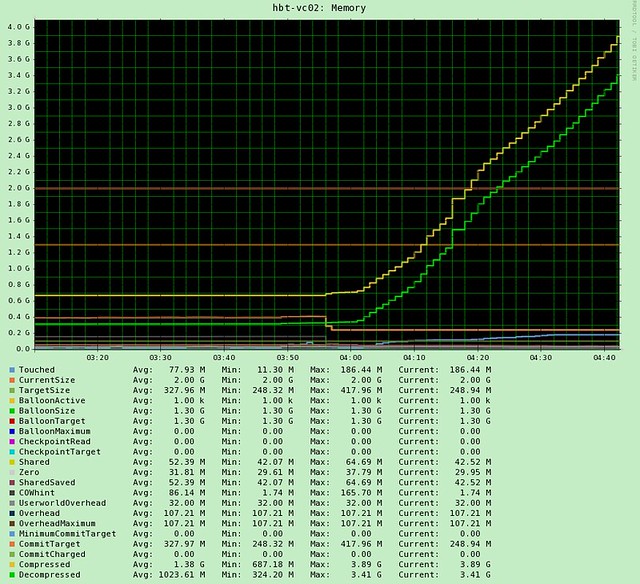
I lost track of vmktree for a while but when I noticed the announcement this week that 0.4.1 was released I decided to give it a spin again. I logged into my vSphere Management Appliance (vMA) and downloaded vmktree with wget. Installed it following the procedures mentioned in the announcement and literally minutes later I could see the first values coming in. To make sure I had something to show you guys I added a limit of 200MB on a virtual machine. As you know I love esxtop but esxtop are still just “dry numbers” which makes it difficult to see a trend. As you can see in the following screenshot, vmktree makes this trend pretty obvious. (Balloon driver is really active and the size of the balloon is increasing._

Besides memory, of course vmktree has more to offer on both per VM and Host level. For instance on a per VM level you can also see CPU and Storage statistics. On a Host level you can see CPU, Storage and Network. Of course these would include things like Latency, Bus resets, dropped packets, disk space usage… you name it, it is in there.

I know there are a lot of vendors these days offering free monitoring solutions, but the cool thing about vmktree is that it is maintained by just a single person Lars Troen. I can only imagine how much work maintaining a tool like this is. Thanks Lars for helping me out by writing this excellent tool! I would like to ask everyone to give it a try, and of course to provide feedback to Lars so that he can possibly improve vmktree over time.

Cool Tool: opvizor

Duncan Epping · Dec 7, 2010 ·

Recently Dennis Zimmer, which most of you probably know of Icomasoft or from the books he authored, emailed me about a new tool his company was developing. I watched the video that is hosted on opvizor.com and must admit that it looks promising. Especially as most solutions today are reactive or semi-pro-active and opvizor is aiming to be pro-active.

opvizor identifies in advance when the virtualized IT infrastructure is lo osing on performance or might crash. Issues in VMware environments can be analyzed and corrected before they become dangerous. In addition, opvizor provides optimized logfiles and makes it possible to share the infrastructure data with internal and external partners, thus allowing more efficient problem solving. “Our goal is, that opvizor anticipates 60 percent of issues from system behavior.”

Now the tool just entered the Beta stage and opvizor is looking for people willing to give it a testdrive and willing to provide feedback! Funnily enough the tool kind of reminds me of a great tool we use internally to take vm-support files apart and analyze them. I can assure you that with the right amount of work / commitment this can turn into a really powerful tool to monitor / healthcheck your environment on a regular basis.

Primary Sidebar

About the author

Duncan Epping is a Chief Technologist in the Office of CTO of the Cloud Platform BU at VMware. He is a VCDX (# 007), the author of the "vSAN Deep Dive", the “vSphere Clustering Technical Deep Dive” series, and the host of the "Unexplored Territory" podcast.

Upcoming Events

May 24th – VMUG Poland
June 1st – VMUG Belgium

Recommended Reads

Sponsors

Want to support Yellow-Bricks? Buy an advert!

Advertisements

Copyright Yellow-Bricks.com © 2023 · Log in