• Skip to primary navigation
  • Skip to main content
  • Skip to primary sidebar

Yellow Bricks

by Duncan Epping

  • Home
  • Unexplored Territory Podcast
  • HA Deepdive
  • ESXTOP
  • Stickers/Shirts
  • Privacy Policy
  • About
  • Show Search
Hide Search

Management & Automation

Startup update: Runecast 2.0

Duncan Epping · Aug 21, 2018 ·

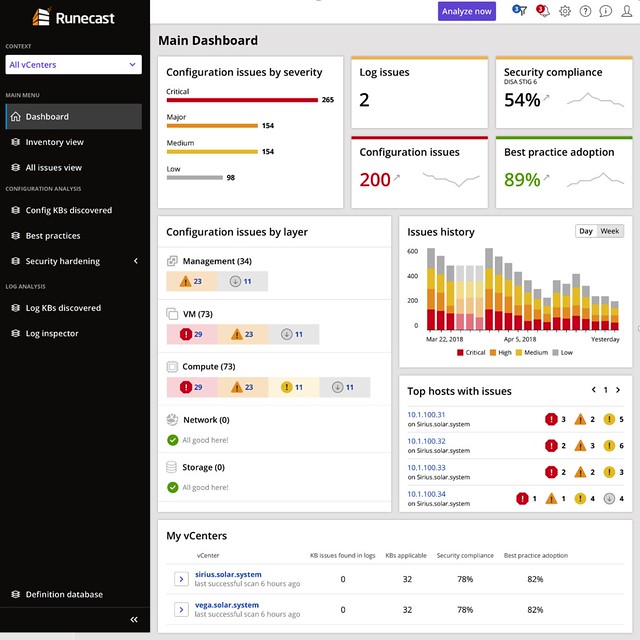
Last week I was briefed by Runecast (together with Cormac) on the new version, Runecast 2.0, which was released/announced today. I always enjoy talking to Stan as every time we talk they have something new which surprises me, or he tells me about something cool on the roadmap. For those who did not read my previous articles, Runecast is a company which focusses on analyzing VMware environments and assess the environment on potential issues. These issues could be anything ranging from configuration issues, driver/firmware issue, to security issues. It reminds me very much of what we have with vSAN which is the health check. The big difference though is that this solution includes many more checks and doesn’t just focus on vSAN but on many different parts of the stack. Just to give you an idea, today Runecast can analyze your vSphere environment up to vSphere 6.7 and can also analyze vSAN and NSX-V. The cool thing is that it also does this “offline”, they have an appliance and regular updates (rules and features) and this means that even in a dark site this would work.
A lot of Runecast’s customers are either in the financial space or government space. I guess this is also why their focus for the 2.0 version was primarily on PCI-DSS. With over 200 technical checks, which map against PCI-DSS requirements, they (as Runecast told me) have by far the largest collection of requirements in an automated analyzer (for VMware) in the industry. Definitely, a smart enhancement, if you are not interested in PCI-DSS, you can simply disable the whole check and it will never show up in your interface. You can also, if only a limited number of clusters should be validated, filter out certain results.
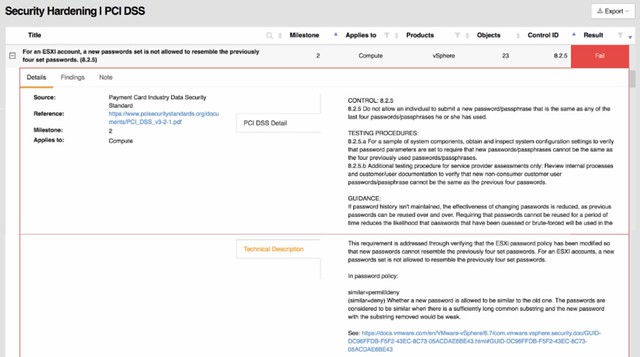
The 20 version of Runecast also comes with a lot of updates around the appliance, now I consider these “internals” as for most customers it is not relevant in terms of the value it offers, but it is important to know from a security perspective I guess.

This version also introduces a historical perspective. Meaning that starting with Runecast 2.0 the historical information of checks is stored. This will allow you to see some form of trending when it comes to the different checks/validations. You could for instance now track if you do updates and maintenance if the number of potential issues is going down. You could also task someone with validating the reported issues and fixing those when or where possible. This should over time improve the availability, reliability, and security of your environment.
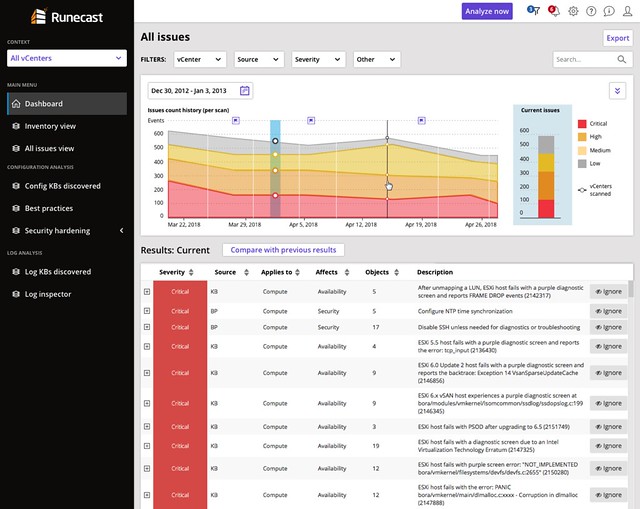
Last but not least the UI has been fully overhauled. They redesigned it just to make it easier to read and understand. Also, a couple of dashboards were added, which makes sense… a new release means new dashboards!

If you happen to go to VMworld, make sure to stop by their booth and have a look, I think you will find it interesting. Or simply read the Runecast blog, and download the appliance and try it out.
Opvizor Performance Analyzer for vSAN

Duncan Epping · Jul 10, 2018 ·

At a VMUG a couple of months ago I bumped into my old friend Dennis Zimmer. Dennis told me that he was working on something cool for vSAN but couldn’t reveal what it was just yet. Last week I had a call with Dennis about what that thing was. Dennis is the CEO for Opvizor, and some of you may recall the different tooling that Opvizor has produced over the years, of which the Health Analyzer was probably the most famous one back then. I’ve used it in the past on various occasions and I had various customers using it. During the briefing, Dennis explained to me that Opvizor started focussing on performance monitoring and analytics a while ago as the health analyzer market was overly crowded and had the issue that is was a one-off business (checks once in a while instead of daily use). On top of that, many products now come with some form of health analysis included. (See vSAN for instance.) I have to agree with Dennis, so this pivot towards Performance Monitoring makes much sense to me.

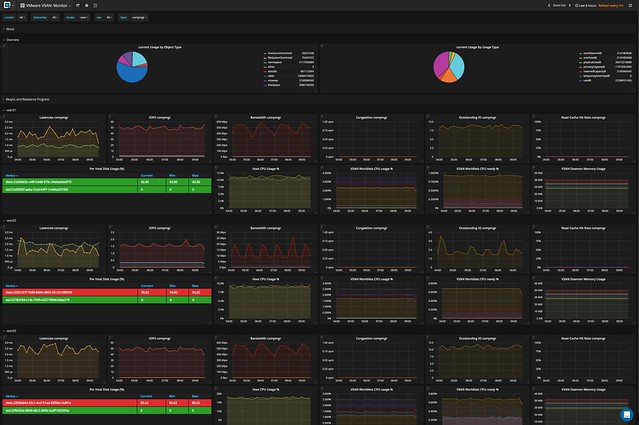
Dennis explained to me how they are seeing more and more customer demand for vSAN performance monitoring especially combined with VMware ESXi, VM and App data. Although vCenter has various metrics, and there’s VROps, he told me that Opvizor has many customers who need more than vCenter or vROPS standard has to offer today and don’t own VROps advanced. This is where Opvizor Performance Analyzer comes in to play and that is why today Opvizor announced they are including vSAN specific dashboards. Now, this isn’t just for vSAN of course. Opvizor Performance Analyzer includes not just vSAN but also vSphere and various other parts of the stack. When talking with Dennis one thing became clear, Opvizor is taking a different approach than most other solutions. Where most focus on simplifying, hiding, and aggregating, the focus for Opvizor is on providing as much relevant detail as possible to fulfill the needs of beginner and professional.

So how does it work? Opvizor provides a virtual appliance. You simply deploy it in your environment and connect it to vCenter and you are ready to go. The appliance collects data every 5 minutes (but 20 seconds intervals of these 5 minutes) and has a retention of up to 5 years. As I said, the focus is on infrastructure statistics and performance analytics and as such Opvizor delivers all the data you ever need.

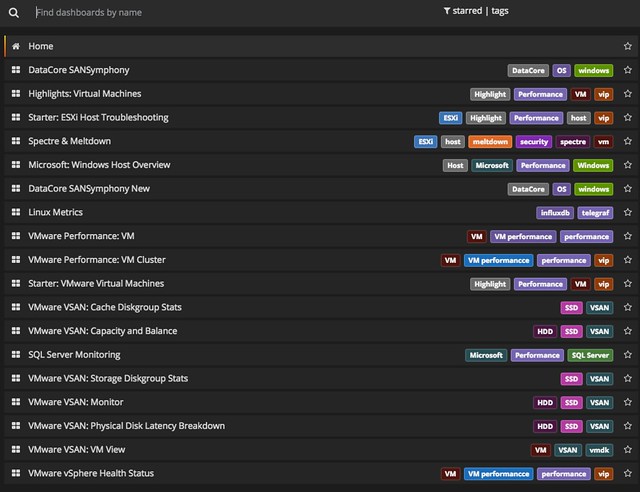
It doesn’t just provide you with all the info you will ever need. It will also allow you to overlay different metrics, which makes performance troubleshooting a lot easier, and will allow you to correlate and pinpoint particular problems. Opvizor comes with dashboards for various aspects, here are the ones included in the upcoming release for vSAN:

  • Capacity and Balance
  • Storage Diskgroup Stats
  • VM View
  • Physical disk latency breakdown
  • Cache Diskgroup stats
  • vSAN Monitor

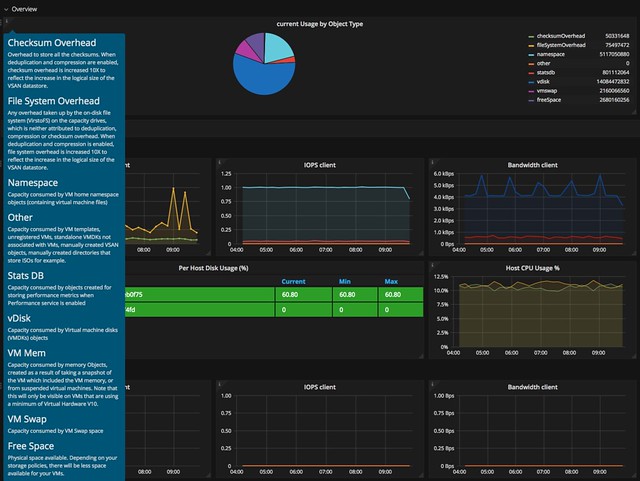
Now I said this is the expert´s troubleshooting tool, but Opvizor Performance Analyzer also provided in-depth information about what each metric is / means and provides starter dashboards for beginners. You can simply click on the “i” in the top left corner of the widget and you get all the info about that particular widget.

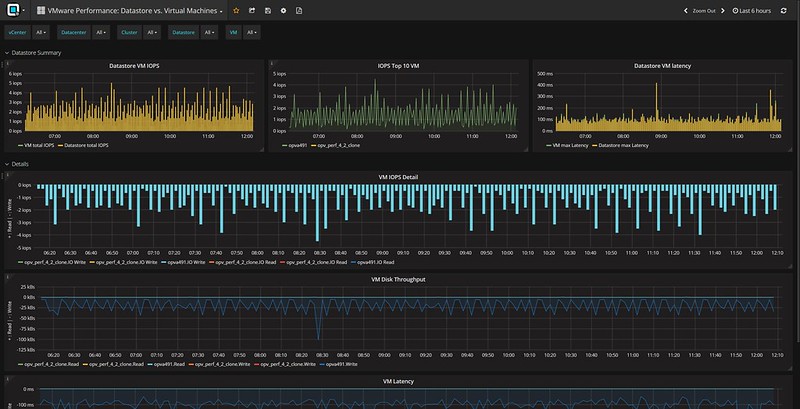
When you do know what you are looking for you can click, hover, and zoom when needed. Hover over the specific section in the graph and the point in time values of the metrics will pop up. In the case below I was drilling down on a VM in the vSAN cluster and looking at write latency in specific. As you can see we have 3 objects and in particular 2 disks and a “vm name space”.

And this is just a random example, there are many metrics to look at and many different widgets and overviews. Just to give you an idea, here are some of the metrics you can find in the UI:

  • Latency (for all different components of the stack)
  • IOPs (for all different components of the stack)
  • Bandwidth (for all different components of the stack)
  • Congestion (for all different components of the stack)
  • Outstanding I/O (for all different components of the stack)
  • Read Cache Hit rate (for all different components of the stack)\
  • ESXi vSAN host disk usage
  • ESXi vSAN host cpu usage
  • Number of Components
  • Disk Usage
  • Cache Usage

And there;s much more, too many to list in this blog. And again, not just vSAN, but there are many dashboards to chose from. If you don’t have a performance monitoring solution yet and you are evaluating solutions like SolarWinds, Turbunomics and others make sure to add Opvizor to that list. One thing I have to say, I spotted a couple of things that I liked to see changed, and I think within 24hrs the Opvizor guys managed to incorporate the feedback. That was a crazy fast turnaround, good to see how receptive they are.

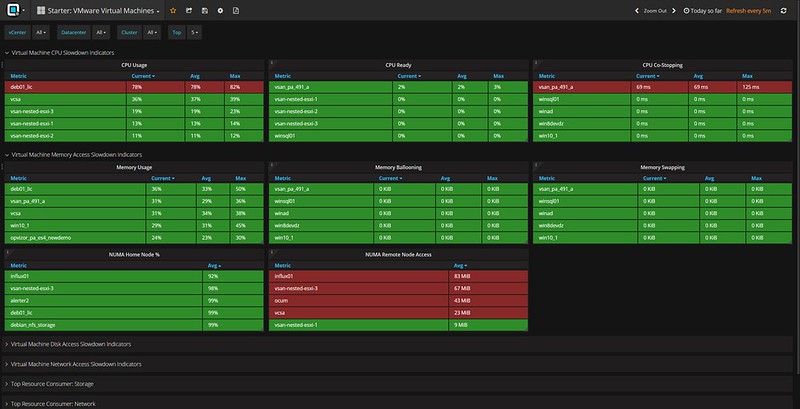
Oh, one more thing I found in the interface, it is these dashboards that deal with things like NUMA. But also things like the Top 10 VMs in terms of IOPS. Both very useful, especially when doing deep performance troubleshooting and optimizing.

I hope that gives you a sense of what they can do. There’s a fully functional 30-day trial, check it out if you want to find out more about Performance Analyzer or simply just want to play around with it. Opvizor announced this brand new version on their own blog here, make sure to give that a read as well!

Module MonitorLoop power on failed error when powering on VM on vSphere

Duncan Epping · Jun 12, 2018 ·

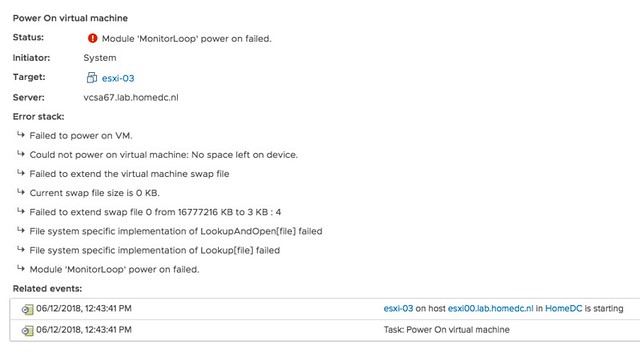
I was playing in the lab for our upcoming vSphere Clustering Deepdive book and I ran in to this error when powering on a VM. I had never seen it before myself, so I was kind of surprised when I figured out what it was referring to. The error message is the following:

Module MonitorLoop power on failed when powering on VM

Think about that for a second, if you have never seen it I bet you don’t know what it is about? Not strange as the message doesn’t give a clue.

f you go to the event however there’s a big clue right there, and that is that the swap file can’t be extended from 0KB to whatever it needs to be. In other words, you are probably running out of disk space on the device the VM is stored on. In this case I removed some obsolete VMs and then powered on the VM that had the issue without any problems. So if you see this “Module MonitorLoop power on failed when powering on VM” error, check your free capacity on the datastore the VM sits on!

More details:

Strange error message, for a simple problem. Yes, I will file a request to get this changed.


How to simplify vSAN Support!

Duncan Epping · May 25, 2018 ·

Last week I presented at the Tech Support Summit in Cork with Cormac. Our session was about the evolution of vSAN, where are we today but more importantly which directly will we be going. One thing that struck me when I discussed vSAN Support Insight, the solution we announced not to long ago, is that not too many people seemed to understand the benefit. When you have vSAN and you enable CEIP (Customer Experience Improvement Program) then you have a phone home solution for your vSphere and vSAN environment automatically. What this brings is fairly simple to explain: less frustration! Why? Well the support team will have, when you provide them your vCenter UUID, instant access to all of the metadata of your environment. What does that mean? Well the configuration for instance, the performance data, logs, health check details etc. This will allow them to instantly get a good understanding of what your environment looks like, without the need for you as a customer to upload your logs etc.
At the event I demoed the Support Insight interface, which is what the Support Team has available, and a lot of customers afterwards said: now I see the benefit of enabling this, I will do this for sure when I get back to the office. So I figured I would take the demo, do a voice over and release it to the public. We need more people to join the customer experience improvement program, so watch the video to see what this gives the support team. Note by the way that everything is anonymized, without you providing a UUID it is not possible to correlate the data to a customer. Even when you provide a UUID the support team can only see the host, vm, policy and portgroup (etc) names when you provide them with what is called an obfuscation map (key). Anyway, watch the demo and join now!

vSphere 6.7 announced!

Duncan Epping · Apr 17, 2018 ·

It is that time of the year again, a new vSphere release announcement! (For those interested in what’s new for vSAN make sure to read my other post.) vSphere 6.7, what’s in a name / release? Well a bunch of stuff, and I am not going to address all of the new functionality as the list would simply be too long. So this list features what I think is worth mentioning and discussing.

  • vSphere Client (HTML-5) is about 95% feature complete
  • Improved vCenter Appliance monitoring
  • Improved vCenter Backup Management
  • ESXi Single Reboot Upgrades
  • ESXi Quick Boot
  • 4K Native Drive Support
  • Max Virtual Disks increase from 60 to 256
  • Max ESXi number of Devices from 512 to 1024
  • Max ESXi paths to Devices from 2048 to 4096
  • Support for RDMA
  • vSphere Persistent Memory
  • DRS initial placement improvements

Note that there’s a whole bunch of stuff missing from this list, for instance there were many security enhancements, but I don’t see the point of me pretending to be an expert on that topic, while I know some of the top experts will have a blog out soon.

Not sure what I should tell about the vSphere Client (h5) at this point. Everyone has been waiting for this, and everyone has been waiting for it to reach ~90/95% feature complete. And we are there. I have been using it extensively for the past 12 months and I am very happy with how it turned out. I think the majority of you will be very very happy with what you will see and with the overall experience. It just feels fast(er) and seems more intuitive.

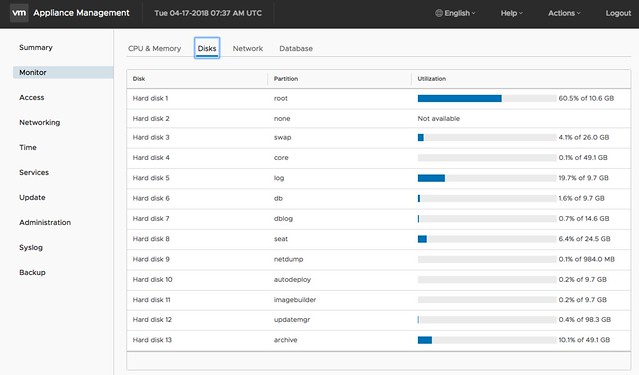
When it comes to management and monitoring of the vCenter Appliance (https://ip of vcenter:5480) there are a whole bunch of improvements. For me personally the changes in the monitoring tab are very useful and also the services tab is useful. Now you can immediately see when a particular disk is running out of space, as shown in the screenshot below. And you can for instance restart a particular service in the “Services” tab.

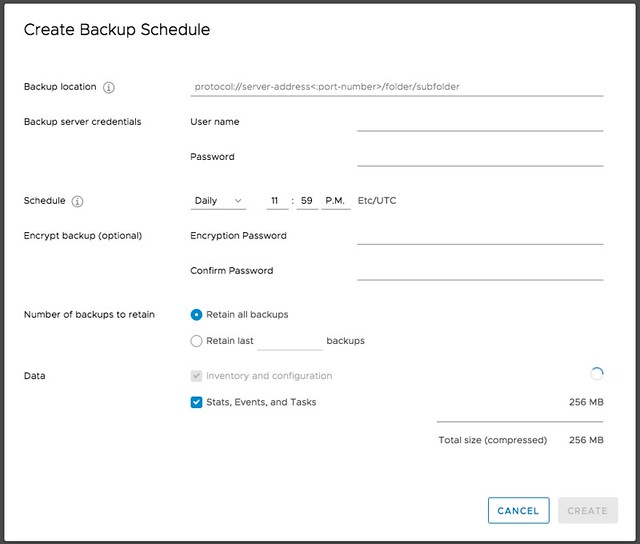
Next is vCenter Backup Management, a lot of people have been asking for this. We introduced Backup and Recovery of the appliance a while ago, very useful, but unfortunately it didn’t provide a scheduling mechanism. Sure you could create a script that would do this for you on a regular cadence, but not everyone wants to bother with that. Now in the Appliance Management UI you can simply create a schedule for backup. This is one of those small enhancements, which to me is a big deal! I’m sure that Emad or Adam will have a blog out soon on the topic of vCenter enhancements, so make sure to follow their blogs.

Another big deal is the fact that we shaved off a reboot for major upgrades. As of 6.7 you now only have 1 reboot with ESXi. Again, a tiny thing going from 2 back to 1, but when you have servers taking 10-15 minutes to go through the reboot process and you have dozens to of servers to reboot it makes Single Reboot ESXi Upgrades a big thing. For those on 6.5 right now, you will be able to enjoy the single reboot experience when upgrading to 6.7!

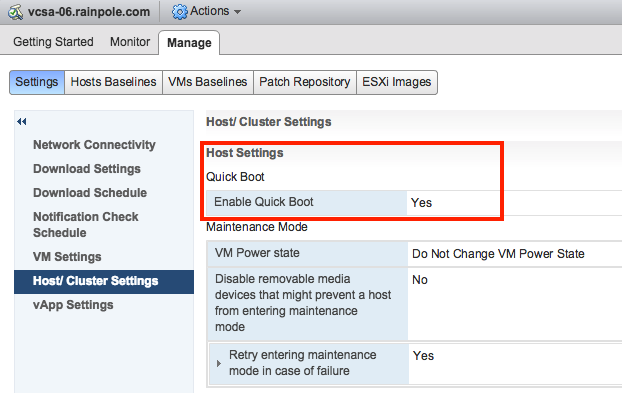
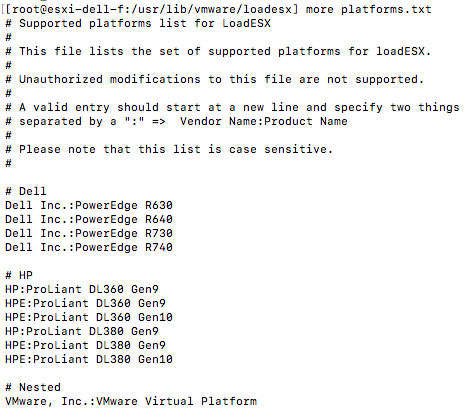
One feature I have personally been waiting for is ESXi Quick Boot. I saw a demo of this last year at our internal R&D conference at VMware and I was impressed. I don’t think many people at that stage saw the importance of the feature, but I am glad it made it in to the release. So what is it? Well basically it is a way to restart the hypervisor without going through the physical hardware reboot process. This means that you are now removing that last reboot, of course this only applies when your used server hardware supports it. Note that with the first release only a limited set of servers will support it, nevertheless this is a big thing. Not just for reboots, but also for upgrades / updates. A second ESXi memory image can be created and updated and when rebooting simply switched over to the latest and greatest instead of doing a full reboot. It will save, again, a lot time. I looked at a pre-GA build and noticed the following platforms are supported, this should be a good indication:

Of course you can also see if the host is supported in the vSphere Client, I found it in the Web Client but not in the H5 Client, maybe I am overlooking it, that could of course be the case.

Then up next are a bunch of core storage enhancements. First 4K Native Drive Support, very useful for those who want to use the large capacity devices. Not much else to say about it other than that it will also be supported by vSAN. I do hope that those using it for vSAN do take the potential performance impact in to account. (High capacity, Low IOPS >> low iops per GB!) Up next is the increase of a bunch of “max values“. Number of virtual disks going from 60 to 256 virtual disks for PVSCSI. And on top of that the number of Paths and Devices is also going up. Number of devices doubled from 512 to 1024 per host, and so has the number of paths as it is going from 2048 to 4096. Some of our largest customers will definitely appreciate that!

Then there’s also the support for RDMA, which is great for applications requiring extremely low latency and very high bandwidth! Note that when RDMA is used most of the ESXi Network stack is skipped, and when used in pass-through mode this also means that vMotion is not available. So that will only be useful for scale-out applications which have their own load balancing and high availability functionality. For those who can tolerate a bit more latency a paravirtualized RDMA adaptor will be available, you will need HW version 13 for this though.​

vSphere Persistent Memory is something that I was definitely excited about. Although there aren’t too many supported server configurations, or even persistent memory solutions, it is something that introduces new possibilities. Why? Well this will provide you performance much higher than SSD at a cost which is lower than DRAM. Think less than 1 microsecond of latency. Where nanoseconds is for DRAM and Flash typically is low milliseconds under load. I have mentioned this in a couple of my sessions so far, NVDIMM will be big, which is the name commonly used for Persistent Memory. For those planning on buying persistent memory, do note that your operating system also needs to understand how to use it. There is a Virtual NVDIMM device in vSphere 6.7 and if the Guest OS has support for it then it will be able to use this byte addressable device. I believe a more extensive blog about vSphere Persistent Memory and some of the constraints will appear on the Virtual Blocks blog soon, so keep an eye on that as well. Cormac already has his fav new 6.7 features up on his blog, make sure to read that as well.

And last but not least, there was a significant improvement done in the initial placement process for DRS. Some of this logic was already included in 6.5, but only worked when HA was disabled. As of 6.7 it is also available when HA is enabled, making it much more likely that you will be able to benefit from the 3x decrease in time that it takes for the initial placement process to complete. A big big enhancements in the DRS space. I am sure though that Frank Denneman will have more to say about this.

  • « Go to Previous Page
  • Page 1
  • Page 2
  • Page 3
  • Page 4
  • Interim pages omitted …
  • Page 44
  • Go to Next Page »

Primary Sidebar

About the Author

Duncan Epping is a Chief Technologist and Distinguished Engineering Architect at Broadcom. Besides writing on Yellow-Bricks, Duncan is the co-author of the vSAN Deep Dive and the vSphere Clustering Deep Dive book series. Duncan is also the host of the Unexplored Territory Podcast.

Follow Us

  • X
  • Spotify
  • RSS Feed
  • LinkedIn

Recommended Book(s)

Advertisements


Copyright Yellow-Bricks.com © 2025 · Log in