• Skip to primary navigation
  • Skip to main content
  • Skip to primary sidebar

Yellow Bricks

by Duncan Epping

  • Home
  • ESXTOP
  • Stickers/Shirts
  • Privacy Policy
  • About
  • Show Search
Hide Search

esxtop

ESXTOP in vSphere 7

Duncan Epping · Apr 2, 2020 · Leave a Comment

I was playing around with Scalable Shares and then noticed some enhancements in esxtop which I didn’t realize were there. I figured I would list the changes I spotted so people are aware of what was added to esxtop in vSphere 7.0. Although it isn’t a huge amount, it is still very valuable to know!

  • RDMA Device “display” is added, so a fully new category for those running RDMA!
    • This, of course, has fields like “Megabits Tx/s”, “% Packets Dropped” etc.
  • CPU Display now has the ability to disable the PCPU usage info at the top by typing “f” followed by “k”
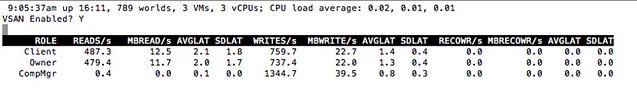
  • vSAN Display now provides UNMAP stats (E, F) additionally

What is also new is that you can now suppress the server physical CPU stats when you type “esxtop -u”, this could be useful when dumping your info into a .csv file. I just added the new details to my ESXTOP page as well, for those who use that as a reference. If there’s more I stumble into then I will report it.

Virtual SAN and ESXTOP in vSphere 6.0

Duncan Epping · Feb 12, 2015 ·

Today I was fiddling with ESXTOP to see if anything was new for vSphere 6.0. Considering the massive number of metrics it already holds it is difficult to find things which stand out / are new. One thing did stick out though which is a new display for Virtual SAN.I haven’t found much detail around this new section in ESXTOP to be honest, but then again I guess most of it speaks for itself. If you are in ESXTOP and press “x” then you will go to the VSAN screen. Now when you press “f” you have the option to add “fields”, I enabled all and the below is the result:

Virtual SAN and ESXTOP

It isn’t a huge amount of detail yet, but being able to see the number of reads, writes and average latency is useful for sure per host. Also what has my interest is “RECOWR/s” and “MBRECOWR/s”. This refers to “recovery writes”, which is the resync of components which were somehow impacted by a failure. If for whatever reason RVC or the VSAN Observer is unavailble then it may be worth peaking at ESXTOP to see what is going on.

Cool Tool: VisualEsxtop

Duncan Epping · Jul 8, 2013 ·

My ESXTOP page is still one of the most visited pages I have, it actually comes in on a second spot just right after the HA Deepdive. Every once in a while I revise the page and this week it was time to add VisualEsxtop to the list of tools people should use. I figured I would write a regular blog post first and roll it up in to the page at the same time. So what is VisualEsxtop?

VisualEsxtop is an enhanced version of resxtop and esxtop. VisualEsxtop can connect to VMware vCenter Server or ESX hosts, and display ESX server stats with a better user interface and more advanced features.

That sounds nice right? Lets have a look how it works, this is what I did to get it up and running:

  • Go to “http://labs.vmware.com/flings/visualesxtop” and click “download”
  • Unzip “VisualEsxtop.zip” in to a folder you want to store the tool
  • Go to the folder
  • Double click “visualesxtop.bat” when running Windows (Or follow William’s tip for the Mac)
  • Click “File” and “Connect to Live Server”
  • Enter the “Hostname”, “Username” and “Password” and hit “Connect”
  • That is it…

Now some simple tips:

  • By default the refresh interval is set to 5 seconds. You can change this by hitting “Configuration” and then “Change Interval”
  • You can also load Batch Output, this might come in handy when you are a consultant for instance and a customers sends you captured data, you can do this under: File -> Load Batch Output
  • You can filter output, very useful if you are looking for info on a specific virtual machine / world! See the filter section.
  • When you click “Charts”  and double click “Object Types” you will see a list of metrics that you can create a chart with. Just unfold the ones you need and double click them to add them to the right pane

There are a bunch of other cool features in their like color-coding of important metrics for instance. Also the fact that you can show multiple windows at the same time is useful if you ask me and of course the tooltips that provide a description of the counter! If you ask me, a tool everyone should download and check out.

If you have feedback, make sure to leave a comment on the flings site as the engineers of this tool will be tracking that to see where improvements can be made.


Using ESXTOP to check VAAI primitive stats

Duncan Epping · Dec 20, 2012 ·

Yesterday a comment was made around a VAAI primitive on my article about virtual disk types and performance. In this case “write same” was mentioned and the comment was about how it would not be used when expanding a thin disk or lazy zero thick disk. Now the nice thing is that with ESXTOP you can actually see VAAI primitive stats. For instance “ATS” (locking) can be seen, but also… write same or “ZERO” as ESXTOP calls it.

If you open up ESXTOP and do the following you will see these VAAI primitive stats:

  • esxtop
  • press “u”
  • press “f”
  • press “o”
  • press “enter”

The screenshot below shows you what that should look like, nice right… In this case 732 blocks were zeroed out using the write-same / zero VAAI primitive.

VAAI primitive stats

Nice advanced ESXTOP tip from #VMworld session INF-VSP1423

Duncan Epping · Sep 24, 2012 ·

I was watching INF-VSP1423 – esxtop for Advanced Users today by Krishna Raj Raja. This is a VMworld 2012 San Francisco session, if you attended SF but did not attend this session look it up and watch it… If you are going to VMworld Barcelona, schedule it. It is an excellent session, deep technical with some great insights presented by a very smart VMware engineer. There was a tip in there which I found very useful.

Krishna showed an example where he noticed a lot of I/O being generated on a particular LUN. How do you figure out who / what is causing this? Well it is not as difficult as you think it would be…

  • Open up esxtop (more details on my esxtop page)
  • Go to the “Device” view (U)
  • Find the device which is causing a lot of I/O
  • Press “e” and enter the “Device ID” in my case that is an NAA identifier so “copy+paste” is easiest here
  • Now look up the World ID under the “path/world/partition” column
  • Go back to CPU and sort on %USED (press “U”)
  • Expand (press “e”) the world that is consuming a lot of CPU, as CPU is needed to drive I/O

This should enable you to figure out which world is driving the high amount of I/Os. Now you can kill it, contact the user / admin causing it… nice right.

There are some more nuggets in this session around PSTATE (power state), co-sharing, Host Caching (llswp) and much more… I am not going to reveal those as you should be attending this session or at a minimum watch it online.

  • Go to page 1
  • Go to page 2
  • Go to page 3
  • Go to page 4
  • Go to Next Page »

Primary Sidebar

About the author

Duncan Epping is a Chief Technologist in the Office of CTO of the Cloud Platform BU at VMware. He is a VCDX (# 007) and the author of the "vSAN Deep Dive" and the “vSphere Clustering Technical Deep Dive” series.

Upcoming Events

14-Apr-21 | VMUG Italy – Roadshow
26-May-21 | VMUG Egypt – Roadshow
May-21 | Australian VMUG – Roadshow

Recommended reads

Sponsors

Want to support us? Buy an advert!

Advertisements

Copyright Yellow-Bricks.com © 2021 · Log in